• Skip to primary navigation
  • Skip to main content
  • Skip to primary sidebar
  • Skip to footer

Allocate Smartly

  • About
    • What We Do
    • List of Strategies
    • Advanced Features
    • 19 Core Ideas
    • FAQs
    • Contact Us
  • Subscribe
  • Blog
  • Members

Tactical Asset Allocation in August

September 2, 2017

This is a summary of the recent performance of a wide range of excellent tactical asset allocation strategies. These strategies are sourced from books, academic papers, and other publications. While we don’t (yet) include every published TAA model, these strategies are broadly representative of the TAA space. Learn more about what we do or let AllocateSmartly help you follow these strategies in near real-time.

Recent Performance of Asset Allocation Strategies
Use the Arrows to Sort This Table
StrategyAugYTD
Davis’ Three Way Model 2.63% 11.67%
Vigilant Asset Allocation 2.35% 12.23%
Varadi’s Minimum Correlation Portfolio 2.20% 13.05%
Browne’s Permanent Portfolio 2.02% 9.03%
Novell’s Tactical Bond Strategy 2.02% 4.34%
Dalio’s All-Weather Portfolio 2.01% 8.54%
Tactical Permanent Portfolio 1.63% 9.09%
Faber’s Global Tactical Asset Alloc. – Agg. 3 1.26% 8.40%
PortfolioCharts’ Golden Butterfly 1.19% 6.98%
Stoken’s Active Combined Asset 1.14% 8.11%
Stoken’s Active Combined Asset – Monthly 1.08% 8.02%
US Max Diversification 1.05% 6.87%
Classical Asset Allocation – Offensive 1.02% 18.71%
Classical Asset Allocation – Defensive 0.95% 12.36%
Faber’s Global Tactical Asset Alloc. 13 0.88% 6.58%
Elastic Asset Allocation – Offensive 0.79% 12.79%
US Equal Risk Contribution 0.79% 6.39%
60/40 Benchmark 0.76% 8.74%
US Min Correlation 0.75% 7.14%
Global Risk Parity Trend Following 0.66% 6.04%
Protective Asset Allocation 0.66% 8.82%
US Max Sharpe 0.62% 8.82%
Protective Asset Allocation – CPR 0.45% 7.63%
Faber’s Sector Relative Strength 0.39% 5.89%
US Risk Parity Trend Following 0.37% 3.25%
Faber’s Ivy Portfolio 0.35% 6.55%
Varadi’s Percentile Channels 0.34% 4.25%
Composite Dual Momentum 0.32% 10.45%
Faber’s Global Tactical Asset Alloc. 5 0.31% 4.35%
Philosophical Economics’ Growth-Trend Timing 0.29% 11.74%
Elastic Asset Allocation – Defensive 0.24% 11.13%
Keuning’s Generalized Protective Momentum 0.22% 6.93%
Robust Asset Allocation – Balanced 0.16% 5.07%
Flexible Asset Allocation 0.14% 7.67%
Glenn’s Paired Switching Strategy 0.09% 8.29%
Robust Asset Allocation – Aggressive 0.02% 11.77%
Adaptive Asset Allocation 0.00% 8.46%
Traditional Dual Momentum -0.04% 11.80%
Faber’s Global Tactical Asset Alloc. – Agg. 6 -0.26% 9.79%

Commentary:

Tactical asset allocation turned in another strong performance in August. The month’s top performing asset classes were an odd bunch, with both traditionally defensive assets like gold (GLD +4.2%) and long US Treasuries (TLT +3.4%), as well as offensive assets like emerging markets (EEM +2.4%) and the Nasdaq 100 (QQQ +2.1%) up big. Notable laggards were anything and everything related to value.

With such a large pool of published strategies to draw on (39 and counting), we’re able to draw some broad conclusions about the state of TAA. The following two charts help to show trends in the asset classes that TAA as a whole is allocating to over time. Members note that you can now see this information updated daily with your new Aggregate Asset Allocation report.

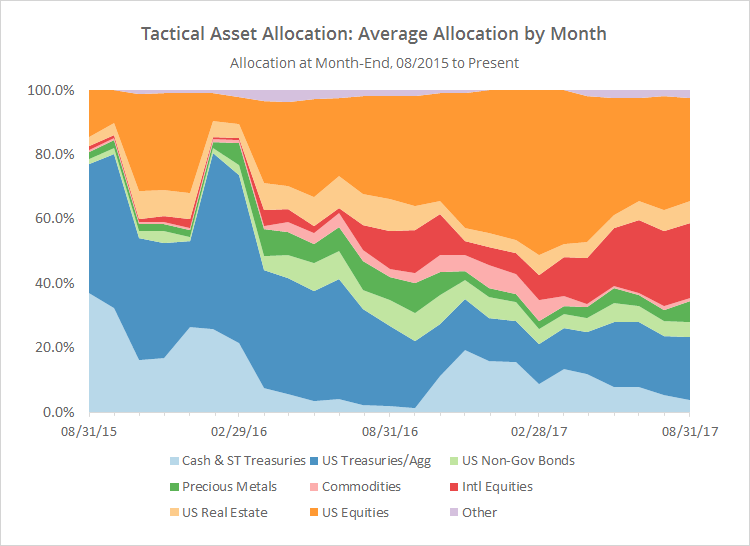
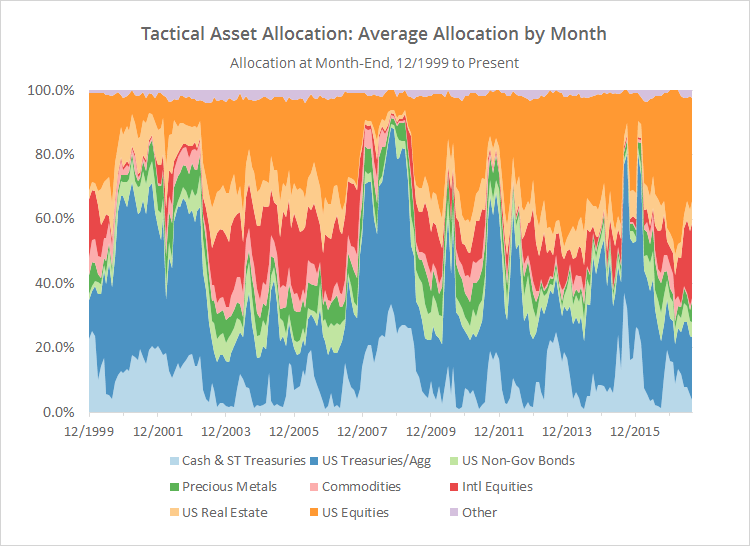
The first chart shows the average month-end allocation to categories of assets by all of the strategies that we track (click for a longer view). For example, “US Equities” may include everything from the S&P 500 to individual stock market sectors.

Important takeaways from this chart: TAA’s exposure to defensive assets like cash (light blue) and US Treasuries (dark blue) remains low. Exposure to commodities (pink) is virtually non-existent, but that’s often happened in the past due to commodities’ tendency towards long periods of flat returns. Exposure to international equities (red) is particularly high at 23%, a level not seen since the end of 2012.


(click for a longer view)

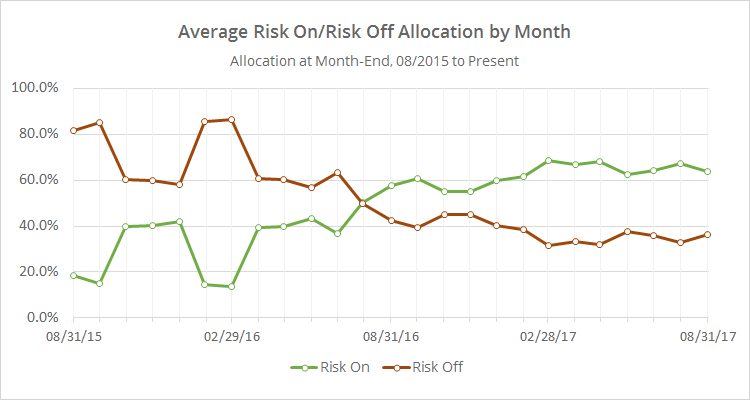
In the second chart below, we’ve combined average TAA allocation into even broader categories: “risk on” (equities, real estate and high yield bonds) versus “risk off” (everything else). I realize that some asset classes don’t fit neatly into these buckets, but it makes for a useful high level view.

This chart shows that overall allocation to risk assets remains high. The last time TAA’s exposure to risk assets stood at these levels was way back in 2007, about 6 months prior to the onset of the Global Financial Crisis (click for a longer view). That’s a good thing if this broad rally continues, but it means that there remains significant exposure to investors here if the market stumbles in September.


(click for a longer view)

We invite you to become a member for about a $1 a day, or take our platform for a test drive with a free limited membership. Put the industry’s best tactical asset allocation strategies to the test, combine them into your own custom portfolio, and then track them in near real-time. Have questions? Learn more about what we do, check out our FAQs or contact us.

YTD Performance of Asset Allocation Strategies
Line chart with 39 lines.
Hover over data to see strategy names. Click and drag chart to zoom.
The chart has 1 X axis displaying Time. Data ranges from 2016-12-01 00:00:00 to 2017-08-01 00:00:00.
The chart has 1 Y axis displaying values. Data ranges from 9957.01 to 11871.06.
Created with Highcharts 12.2.0YTD Performance of Asset Allocation StrategiesDec 2016Jan 2017Feb 2017Mar 2017Apr 2017May 2017Jun 2017Jul 2017Aug 2017Aug…$9,500$10,000$10,500$11,000$11,500$12,000AllocateSmartly.com
Hover over data to see strategy names. Click and drag chart to zoom.
End of interactive chart.

Filed Under: TAA Performance

Previous Post
Next Post

Primary Sidebar

About Us

We have built a platform to track the industry's best Tactical Asset Allocation strategies in near real-time, and combine them into custom portfolios.

Learn about what we do or take our platform for a free test drive.

Follow Our Blog

Recent Posts

  • Front-Running Seasonality in Country ETFs: An Extended Test
  • New Feature: Walked-Forward Optimal Strategy Combinations (aka “Meta Walk-Forwards”)
  • Walking Forward Optimal Strategy Combinations
  • Taming Excessive “Timing Luck” in TAA by Tranching Strategies
  • Piard’s Annual Seasonality

Categories

Footer

About Us

We have built a platform to track the industry's best Tactical Asset Allocation strategies in near real-time, and combine them into custom portfolios.

Learn about what we do and take our platform for a free test drive.

New from Our Blog

  • Front-Running Seasonality in Country ETFs: An Extended Test April 29, 2025
  • New Feature: Walked-Forward Optimal Strategy Combinations (aka “Meta Walk-Forwards”) April 22, 2025
  • Walking Forward Optimal Strategy Combinations March 31, 2025

Helpful Links

  • What We Do
  • List of Strategies
  • Advanced Features
  • Subscribe
  • Blog
  • FAQs
  • Contact Us
  • Member Login

Stay Informed

Follow the latest research from our blog via Twitter, RSS and email:

© 2025 Allocate Smartly. All rights reserved.
  • Affiliates
  • Terms of Service
  • Privacy