This is a summary of the recent performance of a wide range of excellent tactical asset allocation strategies. These strategies are sourced from books, academic papers, and other publications. While we don’t (yet) include every published TAA model, these strategies are broadly representative of the TAA space. Learn more about what we do or let AllocateSmartly help you follow these strategies in near real-time.
| Recent Performance of Asset Allocation Strategies Use the Arrows to Sort This Table |
||||
|---|---|---|---|---|
| MTD/YTD Return | Adjusted for Timing Luck (*) | |||
| Strategy | Feb | YTD | Feb | YTD |
| Vigilant Asset Allocation | 0.12% | 8.32% | -2.38% | 1.66% |
| Novell’s Tactical Bond Strategy | -1.09% | -2.90% | -1.64% | -3.09% |
| US Risk Parity Trend Following | -1.66% | 0.48% | -1.66% | -0.09% |
| US Max Diversification | -1.82% | -1.27% | -1.84% | -1.36% |
| Browne’s Permanent Portfolio | -2.17% | -0.77% | -2.17% | -0.77% |
| Robust Asset Allocation – Balanced | -2.18% | -0.68% | -2.50% | -0.83% |
| Flexible Asset Allocation | -2.21% | 2.19% | -2.76% | 0.76% |
| Stoken’s Active Combined Asset – Monthly | -2.22% | -0.78% | -3.13% | -1.77% |
| Faber’s Global Tactical Asset Alloc. 5 | -2.23% | -0.40% | -2.40% | -0.59% |
| Faber’s Sector Relative Strength | -2.27% | 3.39% | -2.64% | 3.32% |
| Faber’s Global Tactical Asset Alloc. 13 | -2.33% | -0.31% | -2.58% | -0.65% |
| Varadi’s Percentile Channels | -2.50% | -1.19% | -2.68% | -1.88% |
| US Equal Risk Contribution | -2.54% | -2.78% | -2.57% | -2.90% |
| 60/40 Benchmark | -2.56% | -0.10% | -2.56% | -0.10% |
| US Min Correlation | -2.59% | -2.10% | -2.69% | -2.32% |
| Allocate Smartly’s Meta Strategy | -2.61% | 1.19% | -2.61% | 1.19% |
| US Max Sharpe | -2.77% | -1.00% | -2.40% | -0.90% |
| PortfolioCharts’ Golden Butterfly | -2.78% | -1.50% | -2.78% | -1.50% |
| Dalio’s All-Weather Portfolio | -2.84% | -2.32% | -2.84% | -2.32% |
| Tactical Permanent Portfolio | -2.92% | 1.60% | -3.22% | -0.00% |
| Davis’ Three Way Model | -2.98% | -1.17% | -3.12% | -1.33% |
| Composite Dual Momentum | -3.17% | -3.13% | -3.06% | -3.53% |
| Protective Asset Allocation – CPR | -3.19% | 2.56% | -3.54% | 1.98% |
| Protective Asset Allocation | -3.40% | 2.32% | -3.74% | 1.64% |
| Robust Asset Allocation – Aggressive | -3.42% | 0.68% | -3.52% | 0.66% |
| Classical Asset Allocation – Offensive | -3.45% | 3.24% | -3.48% | 3.17% |
| Faber’s Trinity Portfolio Lite | -3.54% | -0.04% | -3.55% | -0.28% |
| Philosophical Economics’ Growth-Trend Timing | -3.64% | 1.79% | -3.64% | 1.79% |
| Glenn’s Paired Switching Strategy | -3.64% | 1.79% | -3.64% | 1.79% |
| Global Risk Parity Trend Following | -3.66% | -0.76% | -2.97% | -0.05% |
| Adaptive Asset Allocation | -3.69% | 1.27% | -4.15% | 0.61% |
| Elastic Asset Allocation – Defensive | -3.74% | 2.24% | -3.56% | 1.98% |
| Varadi’s Minimum Correlation Portfolio | -3.80% | -2.18% | -3.91% | -2.46% |
| Elastic Asset Allocation – Offensive | -3.91% | 2.22% | -3.59% | 2.16% |
| Efficiente Index | -3.94% | 0.34% | -3.99% | 0.03% |
| Faber’s Ivy Portfolio | -3.98% | -2.60% | -3.98% | -2.60% |
| Faber’s Global Tactical Asset Alloc. – Agg. 6 | -4.00% | 0.93% | -4.23% | 0.74% |
| Faber’s Global Tactical Asset Alloc. – Agg. 3 | -4.07% | 2.82% | -4.15% | 2.66% |
| Stoken’s Active Combined Asset | -4.17% | -5.05% | -4.17% | -5.05% |
| Classical Asset Allocation – Defensive | -4.22% | 2.38% | -3.53% | 2.78% |
| Keuning’s Generalized Protective Momentum | -4.49% | 0.74% | -3.79% | 1.36% |
| Traditional Dual Momentum | -4.83% | -0.06% | -4.83% | -0.06% |
Commentary:
 It was a rough February across the asset allocation space, with nearly all significant asset classes down for the month.
Many of the strategies that we track entered the month positioned overly aggressively as a result of our long bull run in risk assets, but in response to the recent weakness, we’re beginning to see TAA de-risk. As we’ve discussed previously, it generally (and quite intentionally) takes TAA about three months to substantially de-risk in response to falling markets, so should this weakness continue, I would expect to see TAA continue to move to defensive assets over the next couple of months.
Vigilant Asset Allocation (VAA) from Dr. Wouter Keller and JW Keuning bucked the trend and made a perfectly timed shift to cash to start the month (on top of its perfectly timed shift to emerging markets prior to that). That was a sweet call for sure, but in the interest of full transparency, there might have been a bit of luck in that move (see the “adjusted for timing luck” stats above). Read more about timing luck and portfolio tranching, a core focus of our members area platform.
Data Dump:
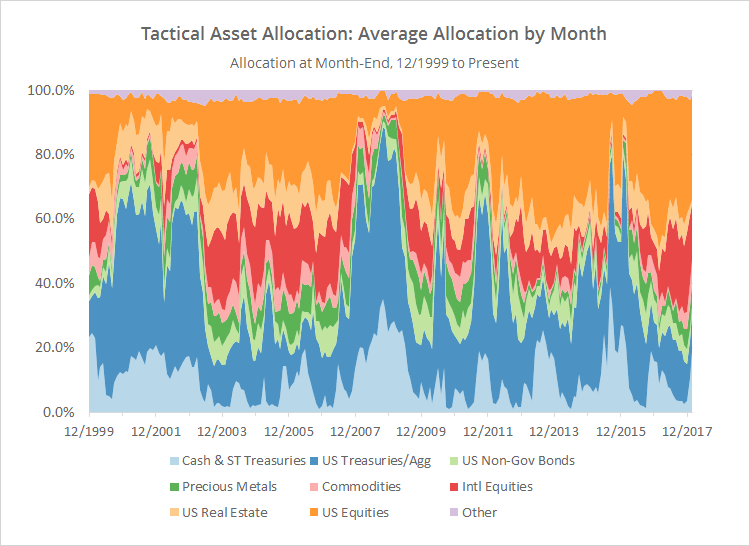
With such a large pool of published strategies to draw on (41 and counting), we’re able to draw some broad conclusions about the state of TAA. The following two charts help to show trends in the asset classes that TAA as a whole is allocating to over time. Members note that you can see this information updated daily with our Aggregate Asset Allocation report.
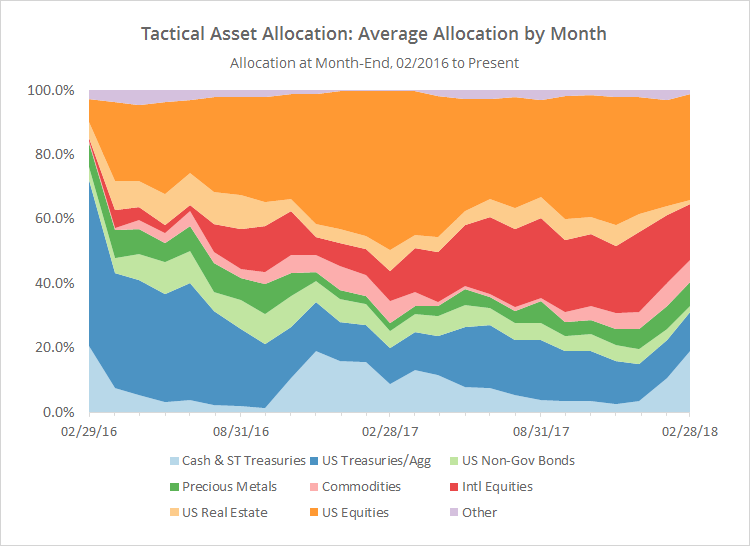
The first chart shows the average month-end allocation to categories of assets by all of the strategies that we track. For example, “US Equities” may include everything from the S&P 500 to individual stock market sectors. The data on the far right of the chart reflects where TAA stood as of the end of February.
The important takeaways from this chart:
The largest shift in allocation for the month was to cash (light blue). TAA did not see a significant increase to other traditionally defensive assets like treasuries, gold or commodities. That makes sense given the broad weakness across nearly all asset classes in February. We don’t want to paint a picture however that TAA has pulled its head into its shell. TAA still has sizeable exposure to risk assets, particularly US and international equities (more on this in the second chart below).
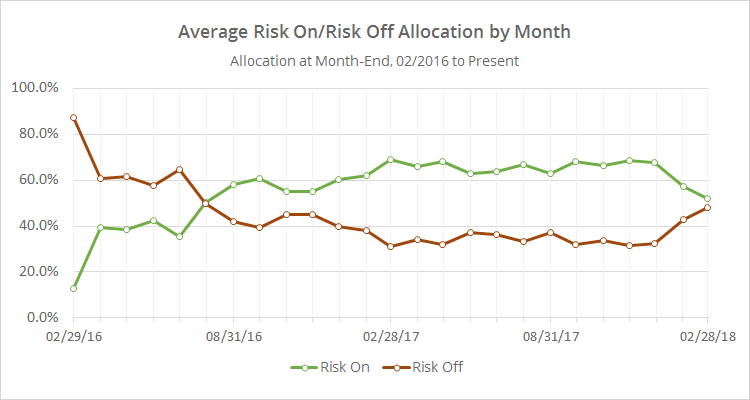
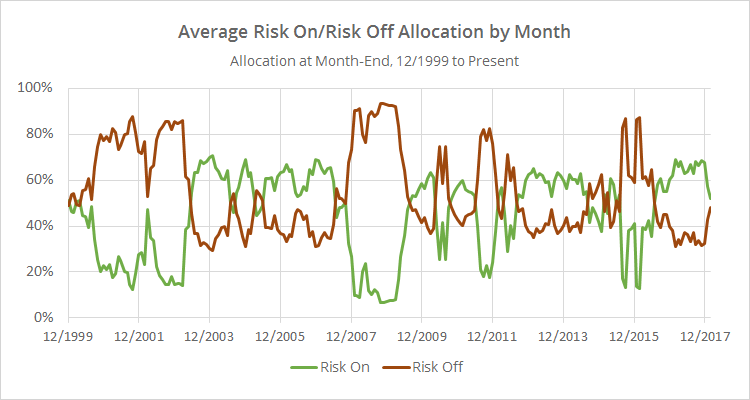
In the second chart below, we’ve combined average TAA allocation into even broader categories: “risk on” (equities, real estate and high yield bonds) versus “risk off” (everything else). We realize that some asset classes don’t fit neatly into these buckets, but it makes for a useful high level view.
This chart shows that TAA is now about equally allocated to risk and defensive assets. Importantly, that doesn’t mean TAA has equal exposure. Risk assets by their nature tend to be more volatile, so in terms of exposure, TAA is still in a “risk on” state. That’s a good thing if our long standing rally continues, but it means that there remains exposure to investors here if the market continues to fall in March.
We invite you to become a member for about a $1 a day, or take our platform for a test drive with a free limited membership. Put the industry’s best tactical asset allocation strategies to the test, combine them into your own custom portfolio, and then track them in near real-time. Have questions? Learn more about what we do, check out our FAQs or contact us.