• Skip to primary navigation
  • Skip to main content
  • Skip to primary sidebar
  • Skip to footer

Allocate Smartly

  • About
    • What We Do
    • List of Strategies
    • Advanced Features
    • 19 Core Ideas
    • FAQs
    • Contact Us
  • Subscribe
  • Blog
  • Members

Tactical Asset Allocation in September

September 30, 2018

This is a summary of the recent performance of a wide range of excellent tactical asset allocation strategies, net of transaction costs. These strategies are sourced from books, academic papers, and other publications. While we don’t (yet) include every published TAA model, these strategies are broadly representative of the TAA space. Learn more about what we do or let AllocateSmartly help you follow these strategies in near real-time.

Recent Performance of Asset Allocation Strategies
Use the Arrows to Sort This Table
  MTD/YTD Return Adjusted for Timing Luck (*)
Strategy Sep YTD Sep YTD
Faber’s Sector Relative Strength 1.15% 11.83% 1.15% 12.64%
Philosophical Economics’ Growth-Trend Timing 0.59% 10.37% 0.59% 10.37%
Glenn’s Paired Switching Strategy 0.59% 9.55% 0.59% 6.83%
Traditional Dual Momentum 0.59% 6.66% 0.59% 6.57%
Accelerating Dual Momentum 0.59% 5.76% 0.59% 5.77%
Davis’ Three Way Model 0.59% 3.98% -0.90% 0.90%
Robust Asset Allocation – Aggressive 0.43% 2.65% 0.31% 2.67%
Robust Asset Allocation – Balanced 0.36% 2.08% 0.25% 1.96%
Faber’s Ivy Portfolio 0.24% 2.98% 0.24% 2.98%
Classical Asset Allocation – Offensive 0.22% 4.70% 0.07% 4.91%
US Max Sharpe 0.19% 5.02% 0.20% 5.50%
Classical Asset Allocation – Defensive 0.19% 5.86% 0.16% 6.44%
Protective Asset Allocation – CPR 0.14% 4.44% 0.03% 3.52%
Global Risk Parity Trend Following 0.11% 0.38% -0.08% 0.84%
Faber’s Global Tactical Asset Alloc. 5 0.03% 3.18% 0.08% 2.76%
Composite Dual Momentum 0.01% -1.39% -0.07% -0.37%
60/40 Benchmark -0.13% 5.04% -0.13% 5.04%
Varadi’s Percentile Channels -0.25% 3.07% -0.05% 1.77%
Faber’s Trinity Portfolio Lite -0.36% 0.02% -0.23% -0.17%
Faber’s Global Tactical Asset Alloc. 13 -0.36% 1.82% -0.31% 1.38%
US Risk Parity Trend Following -0.48% 4.85% -0.57% 4.09%
Faber’s Global Tactical Asset Alloc. – Agg. 6 -0.49% 7.19% -0.56% 4.82%
Keuning’s Generalized Protective Momentum -0.51% 5.17% -0.64% 4.54%
US Min Correlation -0.57% 1.72% -0.60% 1.22%
US Max Diversification -0.60% 1.58% -0.63% 1.40%
Browne’s Permanent Portfolio -0.64% -0.75% -0.64% -0.75%
US Equal Risk Contribution -0.67% 0.34% -0.69% 0.20%
Elastic Asset Allocation – Defensive -0.69% 2.87% -0.66% 3.95%
Elastic Asset Allocation – Offensive -0.81% 4.92% -0.80% 6.10%
Tactical Permanent Portfolio -0.82% 5.36% -0.73% 2.91%
Dalio’s All-Weather Portfolio -0.86% 0.28% -0.86% 0.28%
Adaptive Asset Allocation -0.89% 2.00% -0.85% -0.93%
Allocate Smartly’s Meta Strategy -0.92% 3.25% -0.92% 3.25%
Efficiente Index -1.04% 1.16% -1.01% 0.67%
PortfolioCharts’ Golden Butterfly -1.10% 0.56% -1.10% 0.56%
Flexible Asset Allocation -1.11% 3.54% -1.00% 0.97%
Defensive Asset Allocation -1.14% 4.93% -1.21% 1.84%
Novell’s Tactical Bond Strategy -1.17% -3.23% -1.00% -3.58%
Protective Asset Allocation -1.24% 2.60% -1.15% 2.21%
Faber’s Global Tactical Asset Alloc. – Agg. 3 -1.36% 8.65% -1.27% 6.11%
Vigilant Asset Allocation – Aggressive -1.40% 10.55% -0.99% 1.55%
Vigilant Asset Allocation – Balanced -1.40% 3.45% -1.01% -0.49%
Stoken’s Active Combined Asset -1.60% -4.05% -1.60% -4.05%
Stoken’s Active Combined Asset – Monthly -1.64% -0.40% -1.64% -1.72%
Varadi’s Minimum Correlation Portfolio -1.83% -2.56% -1.79% -2.93%
(*) “Timing Luck” describes the randomness that is introduced simply by the day of the month that an investor chooses to trade a monthly strategy. We believe that these adjusted figures are a more useful representation of the recent “health” of each strategy (read more and more).

Commentary:

Tactical asset allocation as a whole underperformed the US 60/40 benchmark in September. A number of strategies that we track started the month positioned defensively, especially to US Treasuries (read more). That preemptive move was unexpected given the outperformance of risk assets recently. It turned out to be ill timed, as Treasuries and most other defensive assets struggled for the month.

As we show in the data dump below, TAA has begun to take the foot off the brake again, shifting away from US Treasuries, and increasing allocation to corporate bonds.

Data Dump:

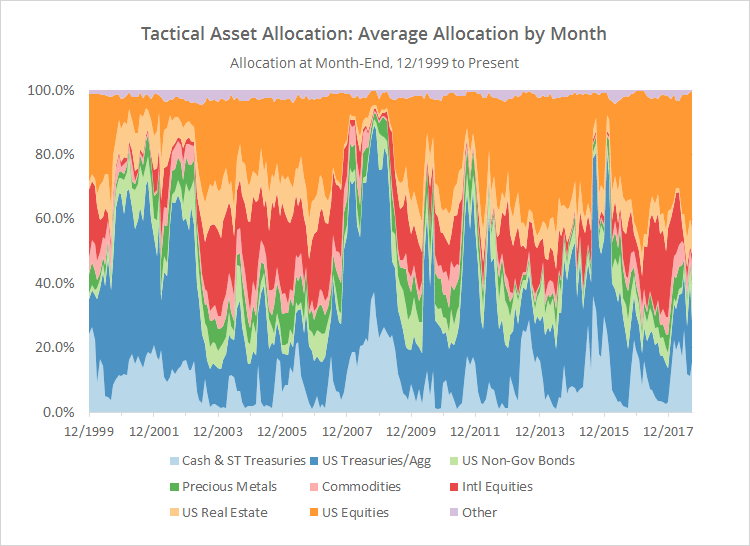
With such a large pool of published strategies to draw on (45 and counting), we’re able to draw some broad conclusions about the state of TAA. The following two charts help to show trends in the asset classes that TAA as a whole is allocating to over time.

The first chart shows the average month-end allocation to categories of assets by all of the strategies that we track. For example, “US Equities” may include everything from the S&P 500 to individual stock market sectors. Defensive assets tend to be at the bottom of the chart, and offensive at the top. The data on the far right of the chart reflects where TAA stood as of the end of the most recent month.

Note the rotation out of US Treasuries (with a decrease from 29% to 12%), and the increased allocation to non-government bonds (from 4 to 12%). International equity exposure remains near historically low levels (click for a longer view).


(click for a longer view)

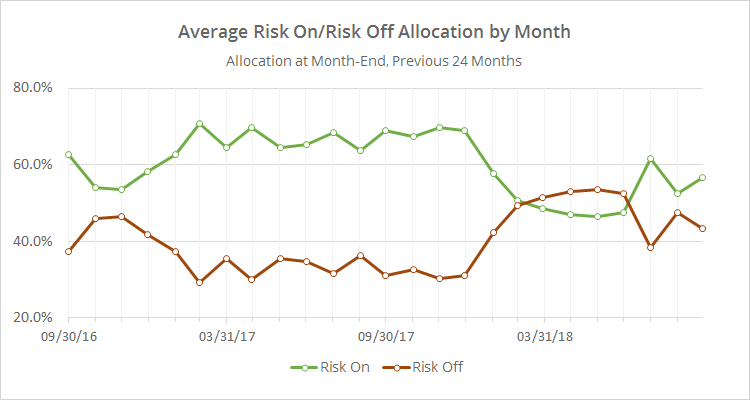
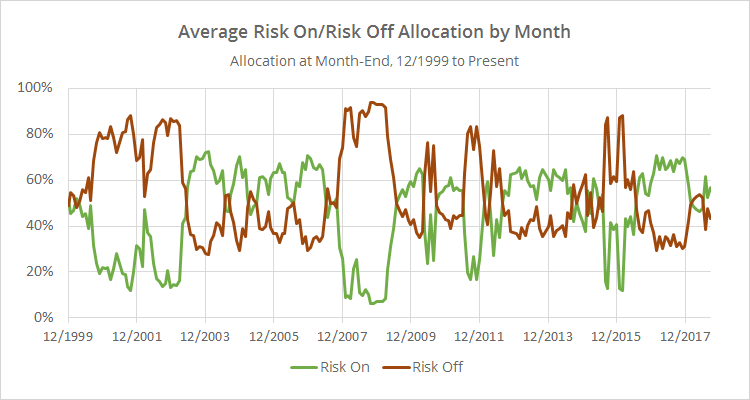
In the second chart below, we’ve combined average TAA allocation into even broader categories: “risk on” (equities, real estate and high yield bonds) versus “risk off” (everything else). We realize that some asset classes don’t fit neatly into these buckets, but it makes for a useful high level view.

This chart shows that, overall, TAA has again begun ratcheting up exposure to risk. There remains significant short-term risk to investors here if the market falters in October.


(click for a longer view)

We invite you to become a member for about a $1 a day, or take our platform for a test drive with a free limited membership. Put the industry’s best tactical asset allocation strategies to the test, combine them into your own custom portfolio, and then track them in near real-time. Have questions? Learn more about what we do, check out our FAQs or contact us.

Filed Under: TAA Performance

Previous Post
Next Post

Primary Sidebar

About Us

We have built a platform to track the industry's best Tactical Asset Allocation strategies in near real-time, and combine them into custom portfolios.

Learn about what we do or take our platform for a free test drive.

Follow Our Blog

Recent Posts

  • Front-Running Seasonality in Country ETFs: An Extended Test
  • New Feature: Walked-Forward Optimal Strategy Combinations (aka “Meta Walk-Forwards”)
  • Walking Forward Optimal Strategy Combinations
  • Taming Excessive “Timing Luck” in TAA by Tranching Strategies
  • Piard’s Annual Seasonality

Categories

Footer

About Us

We have built a platform to track the industry's best Tactical Asset Allocation strategies in near real-time, and combine them into custom portfolios.

Learn about what we do and take our platform for a free test drive.

New from Our Blog

  • Front-Running Seasonality in Country ETFs: An Extended Test April 29, 2025
  • New Feature: Walked-Forward Optimal Strategy Combinations (aka “Meta Walk-Forwards”) April 22, 2025
  • Walking Forward Optimal Strategy Combinations March 31, 2025

Helpful Links

  • What We Do
  • List of Strategies
  • Advanced Features
  • Subscribe
  • Blog
  • FAQs
  • Contact Us
  • Member Login

Stay Informed

Follow the latest research from our blog via Twitter, RSS and email:

© 2025 Allocate Smartly. All rights reserved.
  • Affiliates
  • Terms of Service
  • Privacy