• Skip to primary navigation
  • Skip to main content
  • Skip to primary sidebar
  • Skip to footer

Allocate Smartly

  • About
    • What We Do
    • List of Strategies
    • Advanced Features
    • 19 Core Ideas
    • FAQs
    • Contact Us
  • Subscribe
  • Blog
  • Members

Tactical Asset Allocation in January

February 1, 2018

This is a summary of the recent performance of a wide range of excellent tactical asset allocation strategies. These strategies are sourced from books, academic papers, and other publications. While we don’t (yet) include every published TAA model, these strategies are broadly representative of the TAA space. Learn more about what we do or let AllocateSmartly help you follow these strategies in near real-time.

Recent Performance of Asset Allocation Strategies
Use the Arrows to Sort This Table
Recent Return Adjusted for Timing Luck (*)
Strategy Jan TTM Jan TTM
Vigilant Asset Allocation 8.19% 23.37% 4.14% 19.08%
Faber’s Global Tactical Asset Alloc. – Agg. 3 7.18% 25.15% 7.10% 23.57%
Classical Asset Allocation – Offensive 6.93% 30.72% 6.90% 30.19%
Classical Asset Allocation – Defensive 6.88% 27.11% 6.55% 24.16%
Elastic Asset Allocation – Offensive 6.38% 25.84% 5.97% 25.19%
Elastic Asset Allocation – Defensive 6.22% 23.67% 5.75% 24.79%
Protective Asset Allocation – CPR 5.94% 19.73% 5.73% 19.49%
Protective Asset Allocation 5.92% 20.99% 5.59% 21.70%
Faber’s Sector Relative Strength 5.79% 19.54% 6.12% 21.07%
Philosophical Economics’ Growth-Trend Timing 5.64% 26.30% 5.64% 26.30%
Glenn’s Paired Switching Strategy 5.64% 16.96% 5.64% 18.74%
Keuning’s Generalized Protective Momentum 5.48% 19.16% 5.35% 15.31%
Adaptive Asset Allocation 5.15% 19.65% 4.97% 18.61%
Faber’s Global Tactical Asset Alloc. – Agg. 6 5.14% 20.33% 5.20% 19.41%
Traditional Dual Momentum 5.02% 22.52% 5.02% 22.58%
Tactical Permanent Portfolio 4.65% 13.79% 3.32% 11.78%
Flexible Asset Allocation 4.50% 17.30% 3.62% 20.70%
Robust Asset Allocation – Aggressive 4.25% 21.98% 4.33% 21.67%
Allocate Smartly’s Meta Strategy 4.09% 16.83% 4.09% 16.83%
Faber’s Trinity Portfolio Lite 3.63% 16.60% 3.40% 15.94%
Global Risk Parity Trend Following 3.01% 13.43% 3.01% 12.66%
60/40 Benchmark 2.52% 15.23% 2.52% 15.23%
US Risk Parity Trend Following 2.18% 9.50% 1.60% 7.45%
Faber’s Global Tactical Asset Alloc. 13 2.07% 11.44% 1.98% 10.64%
Faber’s Global Tactical Asset Alloc. 5 1.87% 10.01% 1.85% 9.43%
Davis’ Three Way Model 1.87% 14.42% 1.85% 14.38%
US Max Sharpe 1.82% 15.33% 1.54% 13.43%
Varadi’s Minimum Correlation Portfolio 1.68% 14.19% 1.51% 14.59%
Robust Asset Allocation – Balanced 1.54% 11.10% 1.71% 9.94%
Stoken’s Active Combined Asset – Monthly 1.47% 11.76% 1.40% 11.69%
Faber’s Ivy Portfolio 1.44% 12.41% 1.44% 12.41%
Browne’s Permanent Portfolio 1.43% 10.52% 1.43% 10.52%
Varadi’s Percentile Channels 1.35% 9.47% 0.94% 7.78%
PortfolioCharts’ Golden Butterfly 1.31% 10.17% 1.31% 10.17%
US Max Diversification 0.56% 8.69% 0.48% 8.37%
Dalio’s All-Weather Portfolio 0.53% 11.08% 0.53% 11.08%
US Min Correlation 0.51% 9.86% 0.38% 9.20%
Composite Dual Momentum 0.04% 9.72% -0.49% 8.70%
US Equal Risk Contribution -0.24% 7.56% -0.33% 7.27%
Stoken’s Active Combined Asset -0.92% 10.01% -0.92% 10.01%
Novell’s Tactical Bond Strategy -1.84% 2.90% -1.47% 1.88%
(*) “Timing Luck” describes the randomness that is introduced simply by the day of the month that an investor chooses to trade a monthly strategy. We believe that these adjusted figures are a more useful representation of the recent “health” of each strategy (read more).

Commentary:

It was a strong start to the new year for tactical asset allocation. As was the case for all of last year, TAA was generally positioned offensively to start the month. Some key outperforming asset classes like emerging market equities (ex. EEM +8.3%) were overweighted, and some key underperformers like US Treasuries (IEF -2.2%, TLT -3.3%) underweighted.

Surprisingly given the strength of January’s results however, TAA began rolling back risk exposure at the end of the month. See below.

Data Dump:

With such a large pool of published strategies to draw on (40 and counting), we’re able to draw some broad conclusions about the state of TAA. The following two charts help to show trends in the asset classes that TAA as a whole is allocating to over time. Members note that you can see this information updated daily with our Aggregate Asset Allocation report.

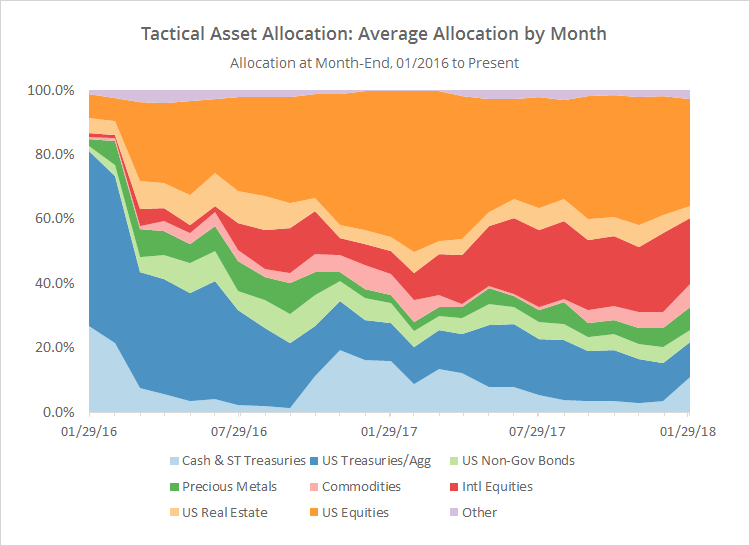
The first chart shows the average month-end allocation to categories of assets by all of the strategies that we track. For example, “US Equities” may include everything from the S&P 500 to individual stock market sectors.

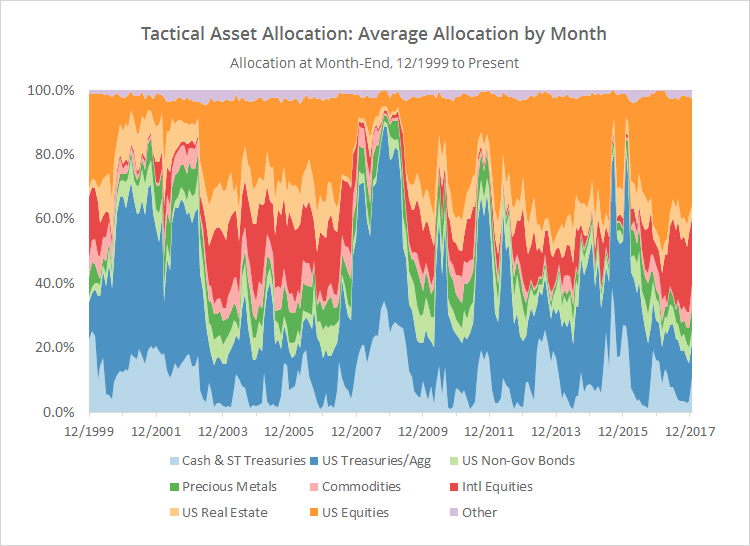
The important takeaways from this chart: TAA is still generally postured offensively relative to history (click for a longer view), but has begun reducing that exposure in a significant way for the first time since late-2006. It’s a little hard to suss that out from this chart, but it will become clearer in the follow up.


(click for a longer view)

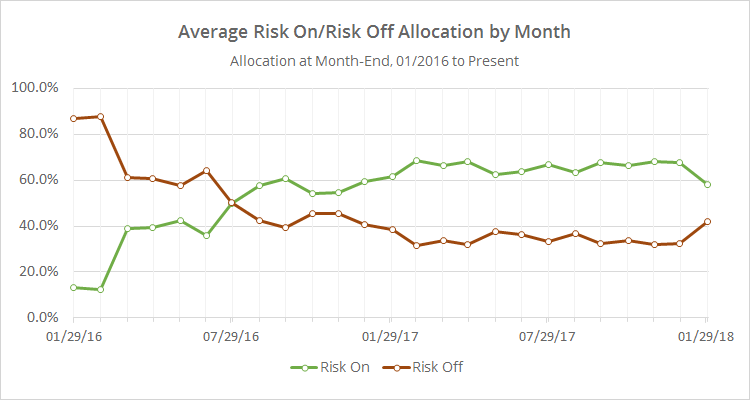
In the second chart below, we’ve combined average TAA allocation into even broader categories: “risk on” (equities, real estate and high yield bonds) versus “risk off” (everything else). We realize that some asset classes don’t fit neatly into these buckets, but it makes for a useful high level view.

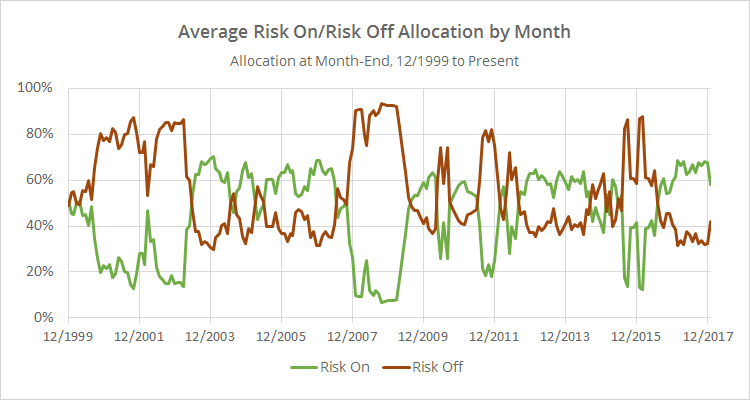
This chart shows that while overall allocation to risk assets remains elevated relative to history (click for a longer view), TAA has backed off of the highs of the last year. Having said that, risk is still high. That’s a good thing if this broad rally continues, but it means that there remains significant exposure to investors here if the market stumbles in February.


(click for a longer view)

We invite you to become a member for about a $1 a day, or take our platform for a test drive with a free limited membership. Put the industry’s best tactical asset allocation strategies to the test, combine them into your own custom portfolio, and then track them in near real-time. Have questions? Learn more about what we do, check out our FAQs or contact us.

Filed Under: TAA Performance

Previous Post
Next Post

Primary Sidebar

About Us

We have built a platform to track the industry's best Tactical Asset Allocation strategies in near real-time, and combine them into custom portfolios.

Learn about what we do or take our platform for a free test drive.

Follow Our Blog

Recent Posts

  • Front-Running Seasonality in Country ETFs: An Extended Test
  • New Feature: Walked-Forward Optimal Strategy Combinations (aka “Meta Walk-Forwards”)
  • Walking Forward Optimal Strategy Combinations
  • Taming Excessive “Timing Luck” in TAA by Tranching Strategies
  • Piard’s Annual Seasonality

Categories

Footer

About Us

We have built a platform to track the industry's best Tactical Asset Allocation strategies in near real-time, and combine them into custom portfolios.

Learn about what we do and take our platform for a free test drive.

New from Our Blog

  • Front-Running Seasonality in Country ETFs: An Extended Test April 29, 2025
  • New Feature: Walked-Forward Optimal Strategy Combinations (aka “Meta Walk-Forwards”) April 22, 2025
  • Walking Forward Optimal Strategy Combinations March 31, 2025

Helpful Links

  • What We Do
  • List of Strategies
  • Advanced Features
  • Subscribe
  • Blog
  • FAQs
  • Contact Us
  • Member Login

Stay Informed

Follow the latest research from our blog via Twitter, RSS and email:

© 2025 Allocate Smartly. All rights reserved.
  • Affiliates
  • Terms of Service
  • Privacy