This is a test of a novel strategy from David Varadi: Growth and Inflation Sector Timing.
Backtested results from 1991 follow. Results are net of transaction costs – see backtest assumptions. Learn about what we do and follow 100+ asset allocation strategies like this one in near real-time.
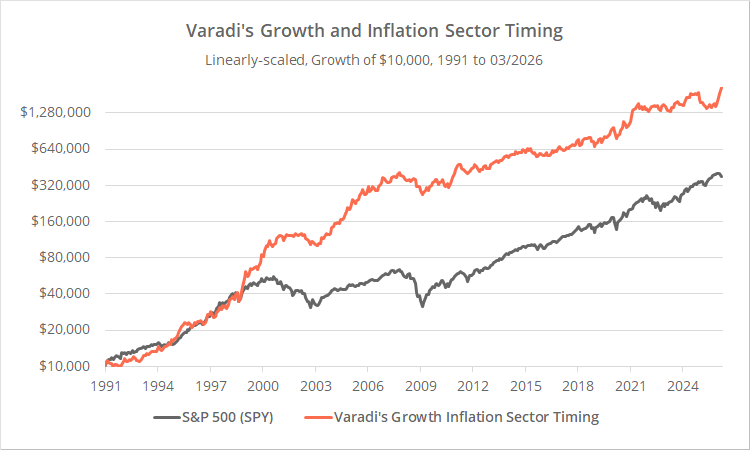
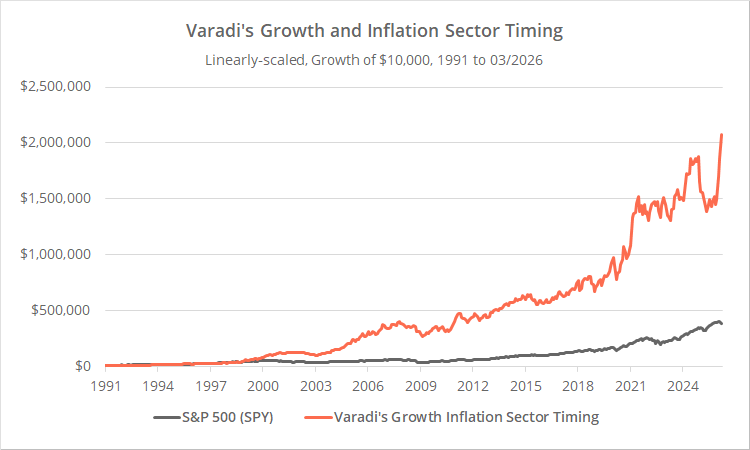
Logarithmically-scaled. Click for linearly-scaled results.
Members know that we are especially interested in novel asset allocation strategies (read why). Varadi’s strategy is definitely that – it’s unlike anything else we track – but a word of warning: this is an extremely volatile strategy, holding a single stock market sector at all times. We think investors should think of it as a unique risk asset, not a total portfolio solution.
How the strategy works:
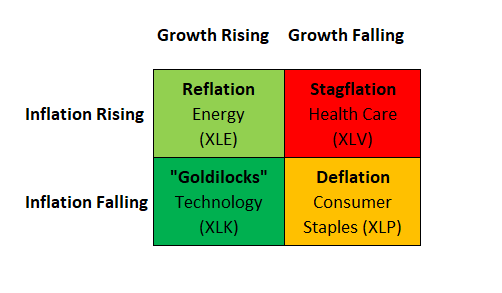
You’ve likely seen a matrix like the following, breaking down market regimes by growth and inflation:
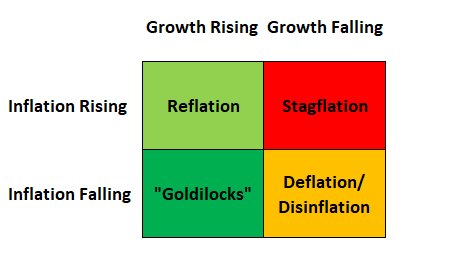
This is the “4 seasons” concept employed by a lot of strategies, most famously Harry Browne’s Permanent Portfolio and Ray Dalio’s All-Weather Portfolio.
Certain stock market sectors perform well during each regime, but how do we know which regime we are currently in in real-time?
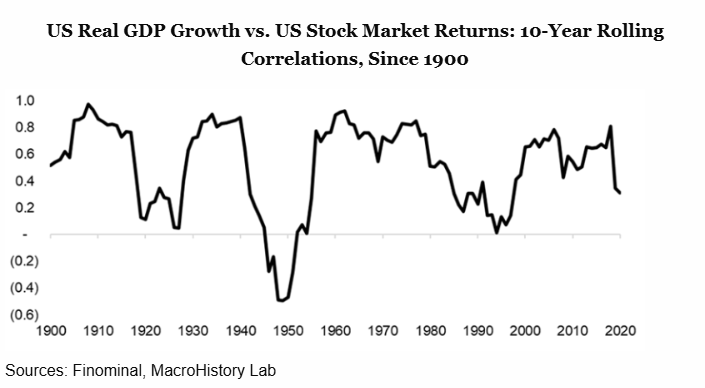
To measure forward growth, Varadi uses the current trend of the S&P 500. The S&P 500 is inherently forward-looking and has been a good proxy for US economic growth over the last 120 years.
But near-term forward inflation is trickier to model. Conventional measures are either backward-looking (ex. CPI) or longer-term in nature (ex. TIPS derived breakeven inflation rates). Varadi takes an alternate approach. He shows that certain sectors have a strong positive or negative relationship with expected inflation:
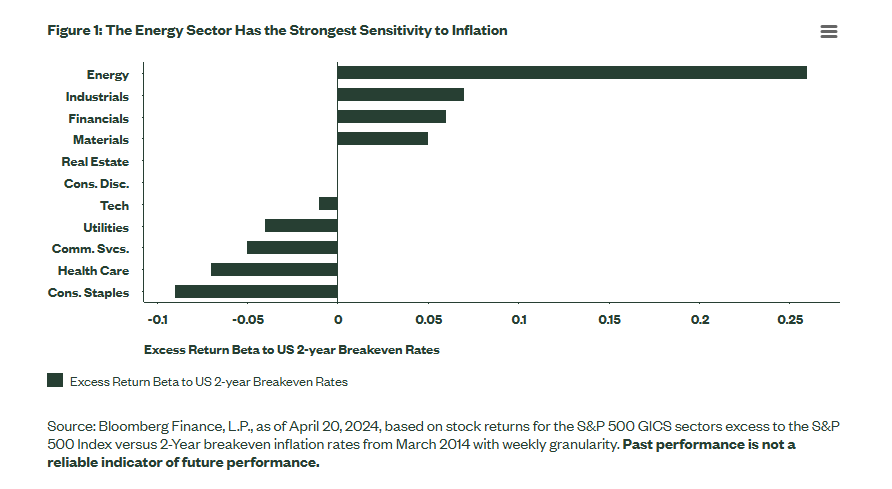
When inflation expectations are rising, Energy, Industrials, Financials and Materials tend to also rise. Conversely, Utilities, Health Care and Staples tend to rise when inflation expectations are falling.
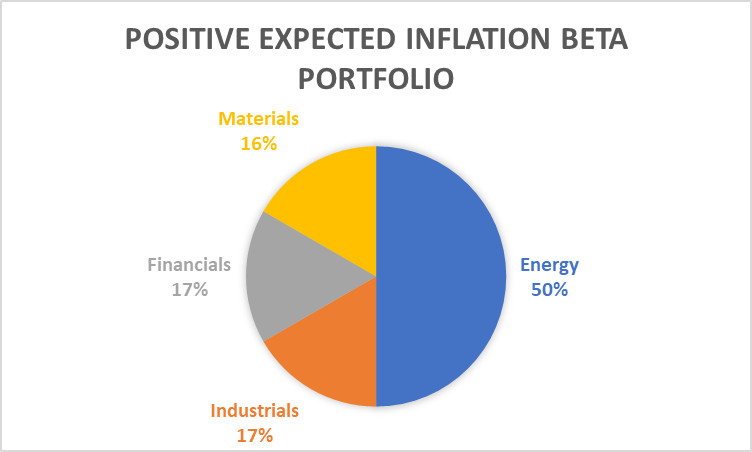
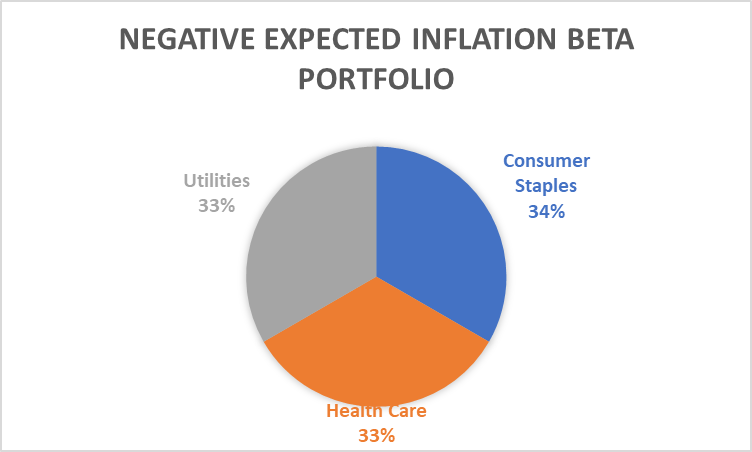
Varadi leverages this idea to create an expected inflation indicator. He creates two hypothetical portfolios, one with sectors that have positive expected inflation beta and the other with sectors that have negative beta.
The two portfolios would look as follows (click to zoom):
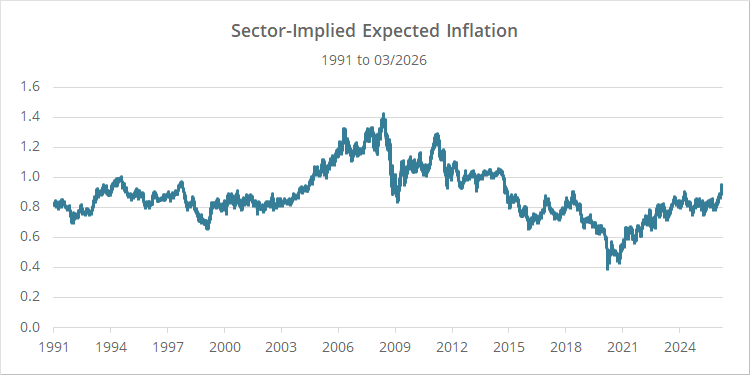
By dividing the positive expected inflation portfolio by the negative we create a “Sector-Implied Expected Inflation” indicator:
Varadi then breaks down how various stock market sectors perform during each market regime: growth up/down and inflation expectation up/down.
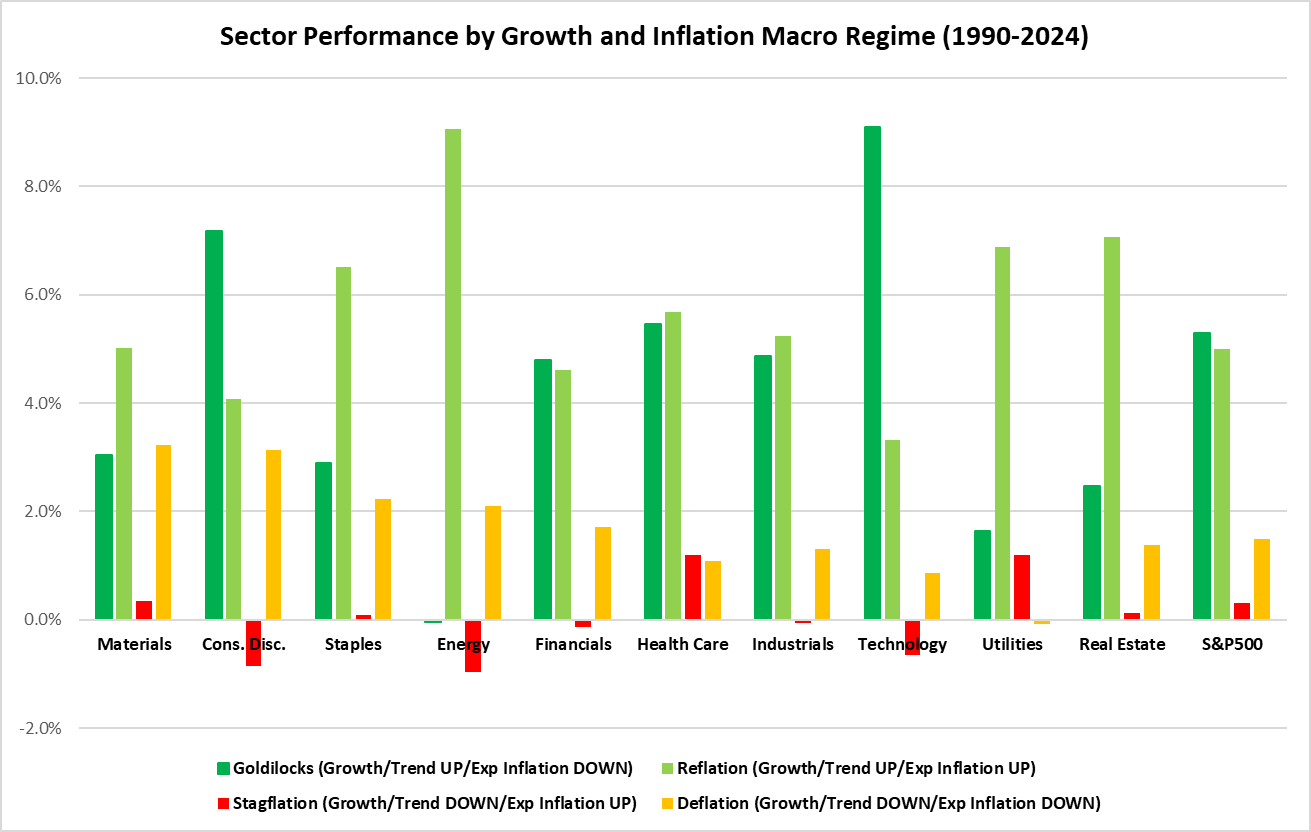
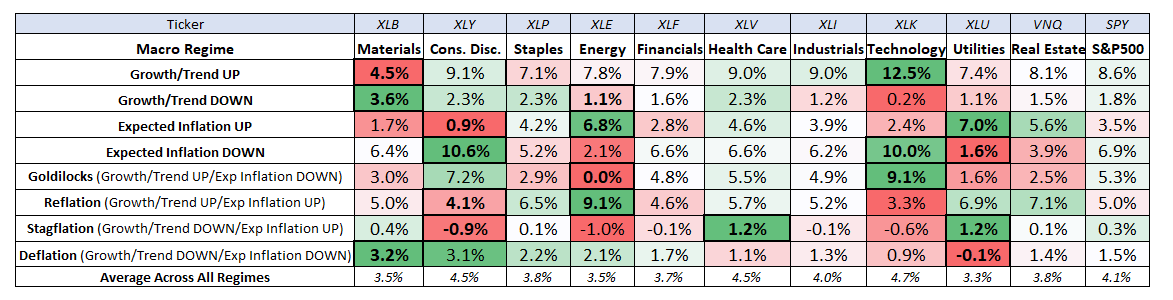
The standout performer during the “goldilocks” regime (growth up, inflation down) has clearly been technology (XLK). During reflation (growth up, inflation up) it has been energy (XLE).
During stagflation and deflation, the best performing sector has been less clear. Varadi doesn’t select the top performing sector, but rather draws on other data to land on the following sector ETFs to represent each market regime:
At the close of each trading day, the strategy determines the current market regime and buys the relevant ETF at the close. Positions are held until a change in regime. Even though the strategy could potentially trade on any trading day, it has averaged less than 6 position changes per year.
Geek note: We are tracking a modified version of Varadi’s original strategy. Varadi’s original exhibited very high turnover. That made sense in a hypothetical world without trading frictions (transaction costs + slippage), but we assume a modest 0.1% trading friction (0.2% round trip). Varadi worked with us to reduce turnover without materially changing the nature of the strategy.
A unique risk asset, not a total portfolio solution:
This should be an obvious statement, but just to be clear: this is not a total portfolio solution the way a conventional TAA strategy aims to be. It holds just a single stock market sector and will frequently experience large swings in performance, both positive and negative.
In 2025 it would have experienced a 24% drawdown (EOM) out of nowhere, but on the flip side, it is up 39% YTD as of the time we’re writing this. It’s a wildcard.
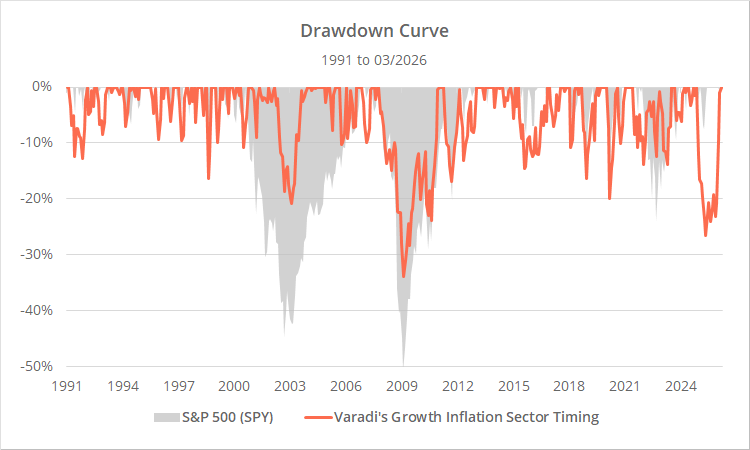
Over the long-term, it would have reduced broad market drawdowns, but would have also failed to outperform the broad market since 2008. To illustrate, below we show the relative performance of Varadi’s strategy versus the S&P 500 since 1991:
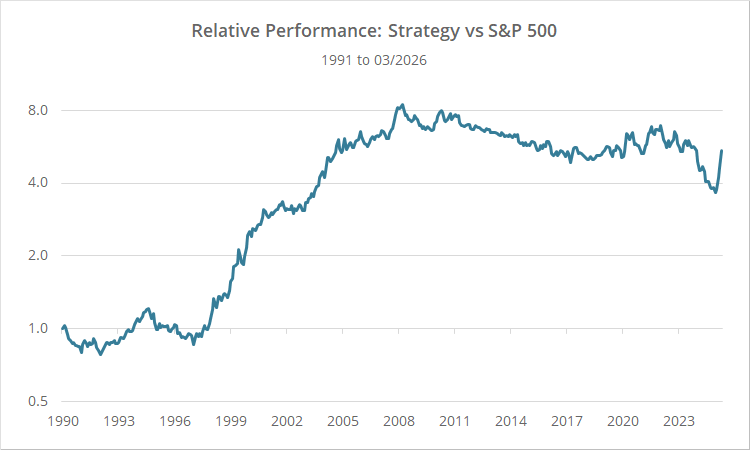
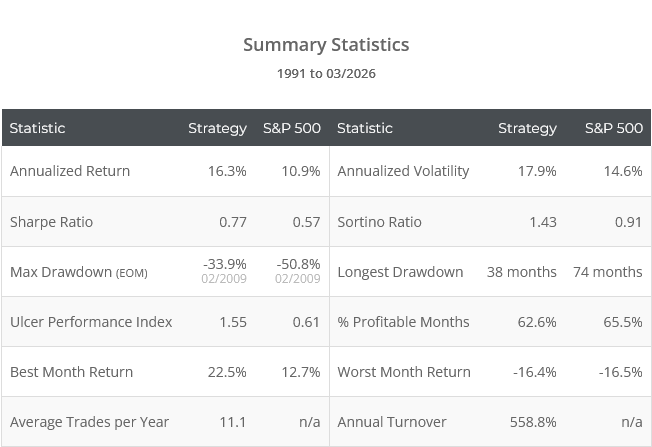
We view the strategy as a unique risk asset, which is meaningful in an era of rising correlation between risk assets. Monthly correlation to the S&P 500 stands at 0.60, and the average pairwise correlation to other strategies we track just 0.41. It may have value as a diversifier or as a partial replacement for equity exposure in a buy & hold portfolio.
Future research ideas:
Ideas to explore:
- Using other, more direct measures of expected inflation such as the breakeven inflation rate derived from TIPS vs Treasury yields.
-
Beta-adjusting our positive and negative expected inflation portfolios.According to our analysis, the positive expected inflation portfolio has significantly higher beta to the broader market than the negative expected inflation portfolio. That means some of the “Sector-Implied Expected Inflation” is not “pure”; it’s driven by market beta. In our tests, performance would be improved by beta adjusting the inflation expectation portfolios.
Outro:
A big thank you to David Varadi for sharing this strategy and providing us with the opportunity to put it to the test. Readers who follow David know that he is a reliable source of “outside the box” ideas.
Ideas like this one are a major reason why we think a service like Allocate Smartly is important. These kinds of novel ideas are released into the wild, but too often get lost in the noise. There’s just too much information out there to keep track of it all. We’re all trying to take a drink from a firehose. We need an independent arbiter to gather these unique ideas and track them on an ongoing basis.
How will David’s strategy respond in the coming years to changing markets? Can the concepts presented here be expanded to improve other developers’ strategies?
New here?
We invite you to become a member for about a $1 a day, or take our platform for a test drive with a free membership. Put the industry’s best tactical asset allocation strategies to the test, combine them into your own custom portfolio, and follow them in real-time. Learn more about what we do.
