This is a test of a simple and effective gold trading strategy from Cyril Dujava of Quantpedia with his research: Cross-Asset Price-Based Regimes for Gold.
Backtested results from 1970 follow. Results are net of transaction costs – see backtest assumptions. Learn about what we do and follow 100+ asset allocation strategies like this one in near real-time.
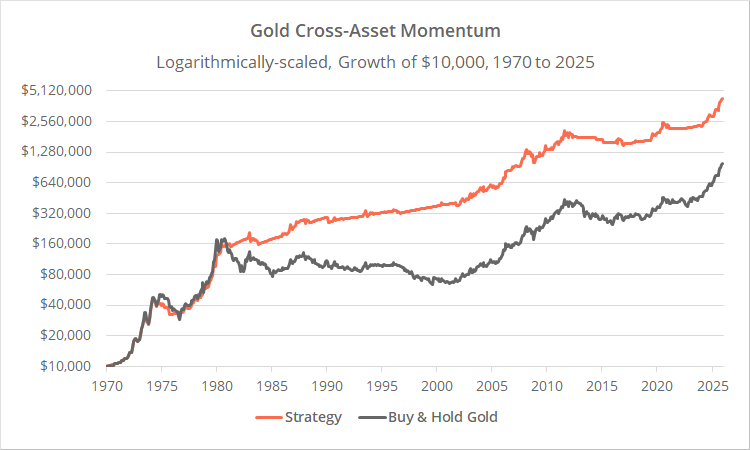
Logarithmically-scaled. Click for linearly-scaled results.
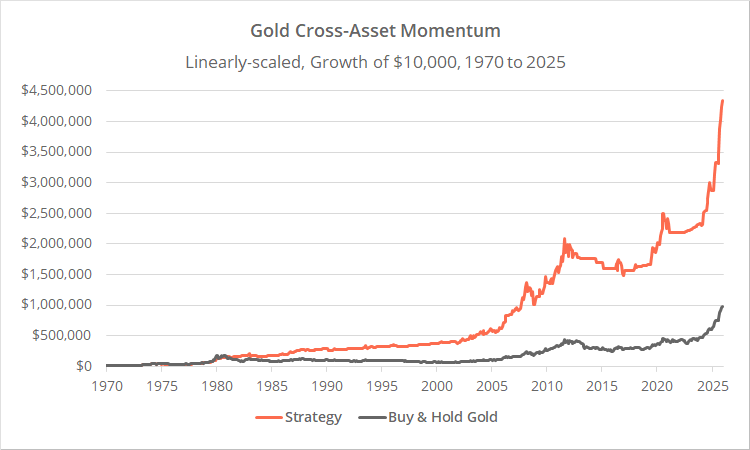
Dujava’s strategy is based on a well-studied link between gold and treasury yields. See Quantpedia’s article for a list of background research.
Strategy rules:
It doesn’t get simpler than this:
- At the close on the last trading day of the month, measure the 12-month total return of gold (represented by GLD) and 10-year US Treasuries (IEF).
- If the 12-month return of both GLD and IEF is positive, go long GLD at the close, otherwise move to cash.
- Hold position until the close of the following month.
When we say Dujava’s strategy is “simple” we don’t mean that as a criticism. All other things held equal, complexity increases the opportunity for overfitting. Strategies should only be as complex as they need to be.
Cross-Asset Momentum:
Like most assets, when gold is showing positive momentum, it has usually been followed by stronger future returns. If the strategy stopped there, it would still provide a significant benefit to simply buying and holding gold.
Dujava’s strategy adds an additional cross-asset momentum requirement. Gold returns have been even stronger when gold and treasury returns are both showing positive momentum.
To illustrate, below we’ve shown next month gold performance following months when gold and US Treasury momentum (as measured by 12m return) was either positive or negative, as well as when ignoring treasury momentum altogether.
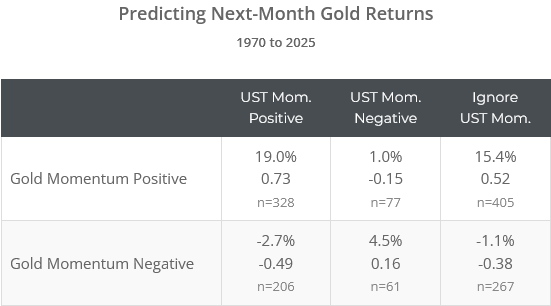
The stats shown are annualized return, Sharpe Ratio and the # of months when the criteria was met.
The cross-asset requirement reduced exposure by 19% (77 / 405), cutting out a significant number of low performing months. Dujava’s data shows that this effect has been consistent over the last 50+ years. We have not shown those results here for brevity, but our data agrees.
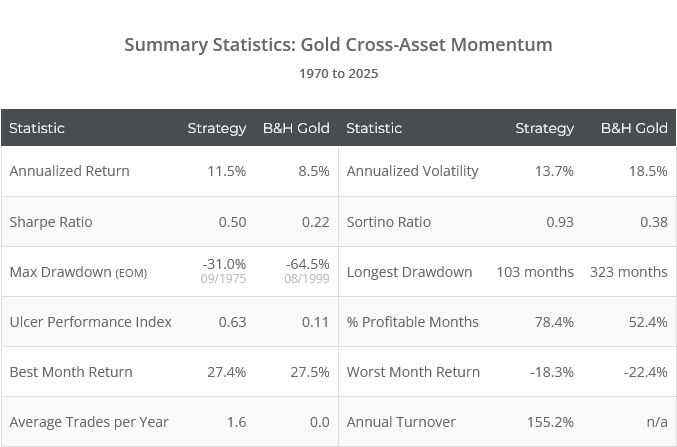
Note: If you eyeball the first charts we presented with a skeptical eye, it appears that the advantage of the strategy versus buy & hold has waned since about 2002. Part of the reason for that is weaker return on cash over much of that period, meaning the strategy hasn’t been rewarded to the same degree when out of gold. If you look at returns only when in the market (like those presented immediately above), the strategy remains similarly effective.
Not a standalone solution:
This is obviously not a standalone portfolio solution. It’s easy to look at 50+ year results and think “yeah, I could have traded that”, it’s another thing to experience those results in real-time.
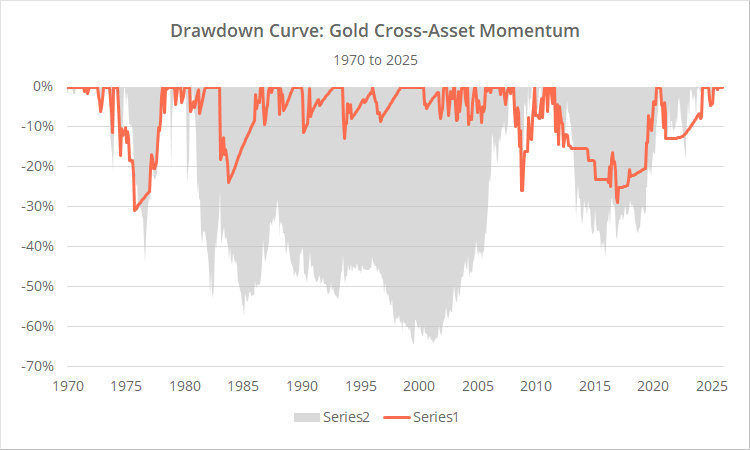
By its nature, gold runs hot and cold. When the going is good (like it is right now), it’s very good, but the strategy would have gone through long periods – up to two decades – of drastically underperforming the broader market. That means that, like all gold investments, it should be limited to a relatively small % of the total portfolio.
Alternatively, we discuss an outside-the-box use below: as an overlay.
Applying the strategy as an overlay:
We track 19 strategies with at least a 10% average allocation to gold (excluding this one). Let’s say we combined all 19 of those strategies into an equally-weighted portfolio.
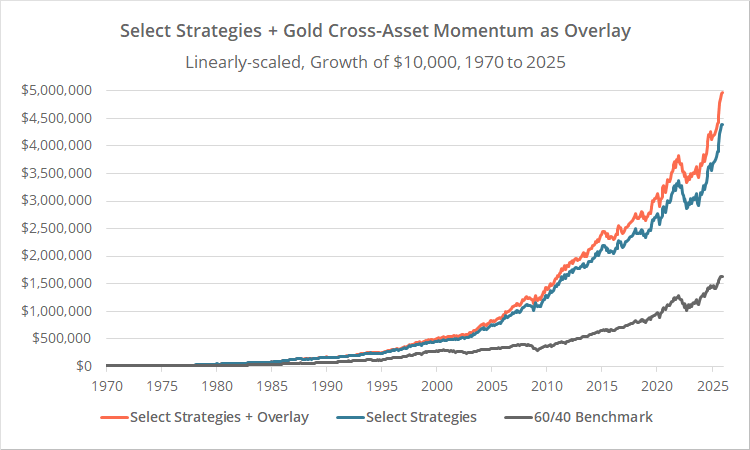
Below we’ve shown the results of our combined portfolio in two flavors. In the first (blue line), we simply trade our combined signal as-is. In the second (orange line), when our combined signal is calling for gold, we first refer to Dujava’s strategy. When both gold and UST momentum is positive, we trade the combined gold signal, otherwise we allocate that portion of the portfolio to cash.
Note: Results account for transaction costs.
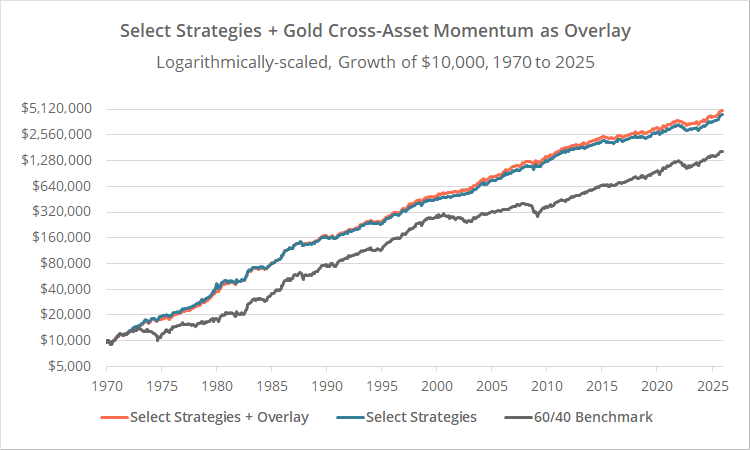
Logarithmically-scaled. Click for linearly-scaled results.
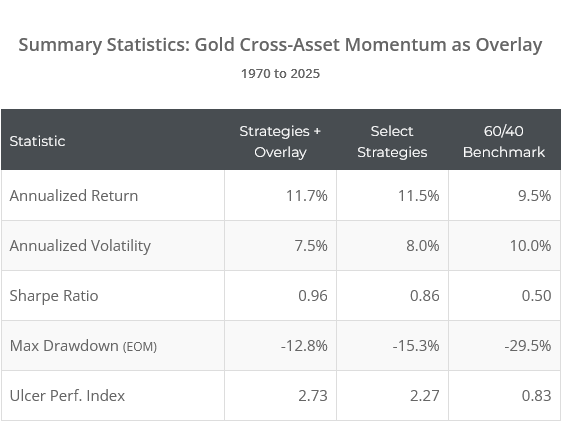
There would have been a marginal improvement in results using the strategy as an overlay, with a slight decrease in risk and a slight increase in risk-adjusted performance.
Is the juice worth the squeeze? In other words, is it worth the extra hassle of checking the cross-asset momentum strategy before confirming any gold signal? We can’t answer that for individuals. We can only model historical results.
Two potential negatives of the overlay:
First, this would make the portfolio less tax efficient (which only matters if trading in a taxable account). And second, it adds a degree of complexity which implicitly raises the potential for overfitting. However, given the simplicity of the strategy, we think that’s a relatively small concern.
Outro:
A big thank you to the folks at Quantpedia for the constant stream of new and novel ideas.
We track 100+ strategies on this platform, so we’re surprised this is the first we’ve encountered that leverages this gold/treasury observation. We hope that the ideas presented here inspire developers to consider this concept in their own strategy design.
New here?
We invite you to become a member for about a $1 a day, or take our platform for a test drive with a free membership. Put the industry’s best tactical asset allocation strategies to the test, combine them into your own custom portfolio, and follow them in real-time. Learn more about what we do.
