We’ve added a new feature for members, the Underperformer Watchlist.
All investment strategies go through rough patches. It’s the nature of taking risks in inherently unpredictable financial markets. One of the difficulties of investing is knowing when a rough patch is just a normal period of poor performance, and when it’s significant enough to warrant further concern. The Underperformer Watchlist is designed to assess that.
Being confident in your investment plan is paramount. Many investors find it difficult to trust strategies that have struggled in recent history, regardless of long-term performance. That’s okay. We track a lot of strategies, so if some small number are misbehaving, we think it’s reasonable to opt for other alternatives until performance is better understood.
What is the Underperformer Watchlist (UW):
The UW is not a list of strategies that have underperformed other strategies. That wouldn’t mean much by itself, and members can already determine that using the Strategy Screener.
The UW is a list of strategies that have underperformed their own expectations. In other words, strategies that have performed worse in recent years than one would expect based on their long-term historical performance.
Importantly, strategies on the UW are not necessarily bad strategies. We track 100+ strategies, and more than half of those would have appeared on the list at some point in history.
How strategies are selected for the Underperformer Watchlist:
We’ll discuss the math in a bit. For now, let’s show some broad concepts.
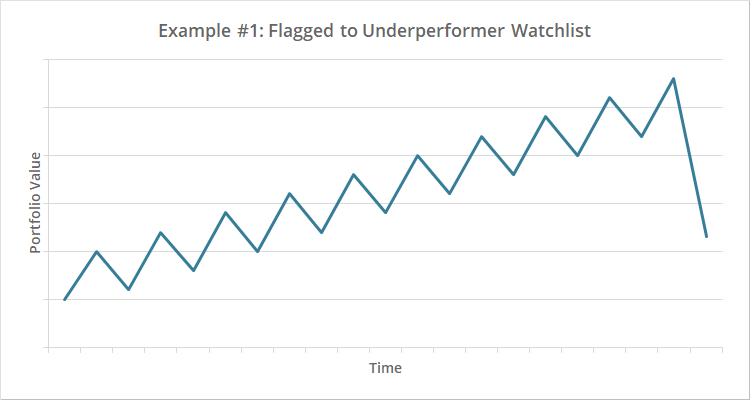
Remember, we’re concerned with a strategy’s performance relative to its own history, so as you’d expect, the following strategy would be flagged:
But the next one would not, despite performing identically in recent history:
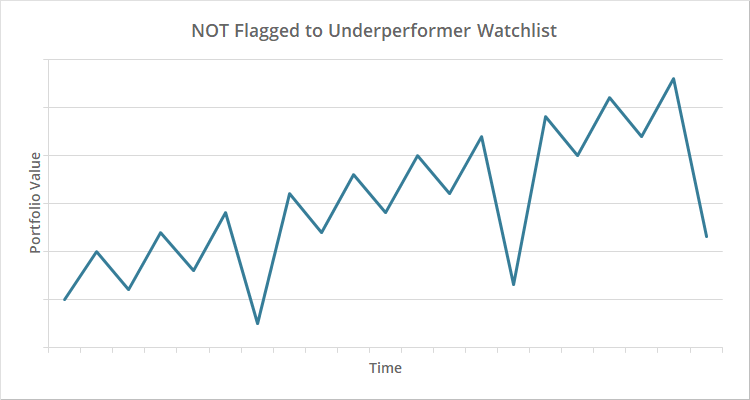
In the first case, the loss was significantly worse than one would expect based on the earlier record, but in the second case, the loss was reasonably in line with historical norms.
Note however that the UW is not based on loss alone. It’s based on any significant deterioration in performance. That means the following strategy would also be flagged:
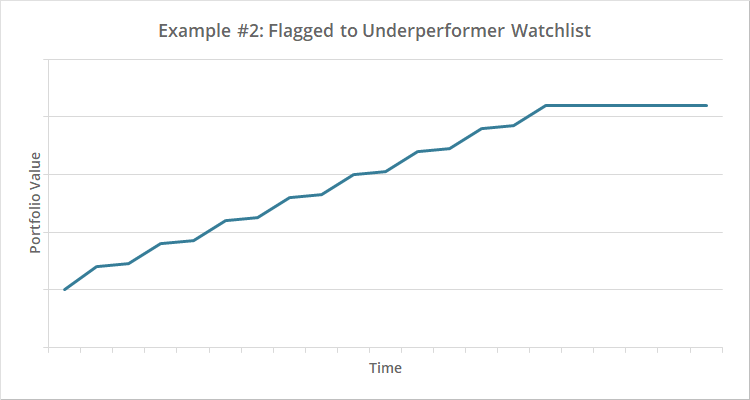
The extended period of flat performance was far enough outside of historical norms.
Also, performance is measured both in absolute terms and relative to a benchmark, so the following strategy would be flagged as well (blue = strategy, green = benchmark):
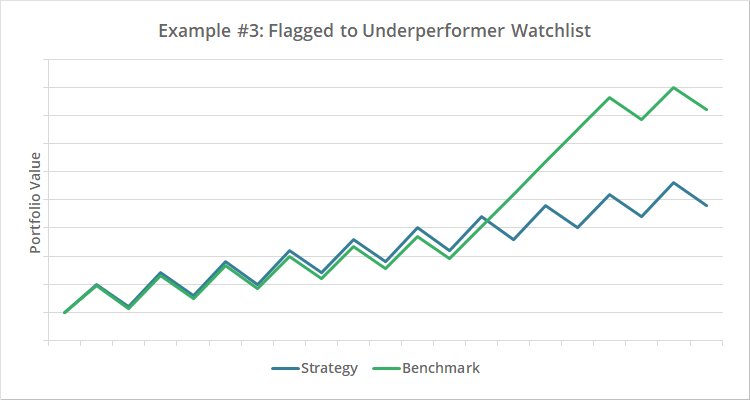
In absolute terms, the strategy continued to do what it had always done, but unlike the past, it underperformed its benchmark badly.
Strategies on the Underperformer Watchlist are not forever bad:
As mentioned previously, more than half of the 100+ strategies we track would have appeared on the watchlist at some point in history.
History is finite, but the future is infinite, and outliers are inevitable. That means that every strategy will eventually end up on the list, because at some point the strategy will behave worse than the finite range of past behavior. That could be tomorrow or it could be 100 years from now.
Appearing on the UW doesn’t in and of itself mean a strategy is bad, only that extra caution is warranted.
How we would use the Underperformer Watchlist:
The shotgun approach would be to avoid all strategies on the UW full stop. Fair enough. Members could build a diversified portfolio with strategies not on the list.
However, we think that there’s room for some discretion. Below are two real-world examples based on strategies currently on the list; one that is overfit and should probably be avoided, and another that is likely just going through a rough spell:
Dividend and Growth: When we first covered this strategy, we concluded that the strategy had a high probability of overfitting, making it less likely to perform as well in the future as it had historically. That proved truer than we expected, and the strategy has performed terribly since being added to the platform.
We expect an overfit strategy to remain on the report much longer than a more robust one. Overfit expectations are implicitly too optimistic, making it more likely the strategy will continue to underperform those too-optimistic expectations.
This is a prime example of a strategy that either should be avoided, or at the very least, come with an understanding that historical backtested results are not relevant to future out-of-sample results.
Risk Premium Value (RPV): This strategy has been 100% allocated to cash since mid-2023. That makes sense. It’s a valuation strategy, and by most metrics, financial markets have been significantly overvalued for a long time. Because the market has soared over that time and RPV has underperformed so badly, it has landed on the UW.
This is an example of a strategy we believe is reasonably robust; it’s simply out of favor. Markets can remain overvalued for a long time, RPV may still prove right in the end, and we think the strategy may still have a place in a diversified Model Portfolio.
Mean-reversion and “catching the falling knife”:
We previously published an analysis of investing in “distressed strategies”.
We showed that there has been some benefit to “catching the falling knife”. As strategies approach, and even exceed, their previous max drawdown, they have tended to generate above average returns in the short-term (next 1 to 12 months). How does that previous analysis jibe with the UW? Should we actually be embracing these UW strategies?
Both ideas are valid, they’re just relevant to different timeframes and have different purposes.
For investors looking for short-term opportunity and willing to white knuckle a high risk/high reward trade, then yes, our previous analysis stands. As strategies approach and exceed their previous max drawdowns, they have tended to generate above average returns in the short-term.
The UW however is longer-term in nature. Moving onto and off of the list will usually happen over the course of multiple years or even a decade plus. This is more relevant to investors creating a portfolio to set and forget for the long-term.
Again, both ideas are valid. One is shorter-term and the other longer. One is a high risk/high reward play. The other is about long-term portfolio design.
The math for the nerds:
The UW is created based on Interquartile Ranges (IQR).
We first calculate rolling 12, 18, 24, 30 and 36 month returns for each strategy (hereafter, n = # of months), both in absolute terms and relative to a benchmark.
That benchmark is unique to each strategy, based on the strategy’s average asset allocation up to that moment in history. We do this so that we can isolate the impact of timing, as opposed to an unlucky asset universe. For example, we wouldn’t want to judge a bond-only strategy against a stock market benchmark.
We then flag current n month returns that are more than 1.5 IQR below Quartile 1, as measured n months prior. This is a common threshold in data analysis for identifying outliers.
Strategies remain on the UW until their current n month return exceeds the Quartile 1 return from n months prior. Quartile 1 represents returns that are below average, but still well within historical norms.
We list the n month lookback (from 12 to 36 months) that caused the strategy to be added to the UW. Strategies can move to a longer lookback if underperformance persists.
Longer lookbacks are harder to recover from than shorter lookbacks. In other words, a strategy flagged for its 36-month return will likely remain on the report much longer than one flagged for its 12-month return.
How the Underperformer Watchlist will affect the platform:
For now, the UW will affect the member’s platform in three ways:
- The Underperformer Watchlist report itself. You will find the report under the “Strategies” menu. The report is updated monthly, after the last trading day of the month.
- On the list of All Strategies, we’ve added a icon next to each flagged strategy. This is just a simple, visual clue that the strategy is on the watchlist.
- On the Portfolio Optimizer, members now have the option to exclude UW strategies from their optimizations. It’s an “all in” or “all out” decision. Pro members still have the ability to pick and choose.
Members, check out the Underperformer Watchlist now. Questions? Comments? Contact us.
New here?
We invite you to become a member for about a $1 a day, or take our platform for a test drive with a free membership. Put the industry’s best Tactical Asset Allocation strategies to the test, combine them into your own custom portfolio, and follow them in real-time. Learn more about what we do.
