This is a summary of the recent performance of a wide range of excellent tactical asset allocation strategies, net of transaction costs. These strategies are sourced from books, academic papers, and other publications. While we don’t (yet) include every published TAA model, these strategies are broadly representative of the TAA space. Learn more about what we do or let AllocateSmartly help you follow these strategies in near real-time.
Commentary:
 Tactical Asset Allocation as a whole did a good job managing December’s huge losses in risk asset classes. 84% of strategies outperformed the 60/40 benchmark, and more than a third turned in a positive return for the month.
TAA entered December positioned fairly defensively, despite a strong showing in November from many risk assets. “Staying the course” paid off. So far so good.
TAA’s performance to start the new year is likely to be extreme (either extremely good or extremely mediocre). As we show in the data dump below, TAA is now postured very defensively. The average allocation to defensive asset classes stands at 88%. Those are levels not seen since the 2008-09 Global Financial Crisis. If we see a strong market recovery to start the year, TAA is going to be left underperforming on the sidelines. But if recent market weakness continues, TAA is going to be riding high and dry. This remains a “hero or zero” moment for TAA.
A quick note about one of our favorite topics, “timing luck”, or the randomness that is introduced simply by the arbitrary day of the month that an investor chooses to trade a monthly strategy.
This month provided a perfect example of timing luck. One of our top performing strategies for the month, Accelerating Dual Momentum, returned +5.9% in December, when traded at month-end as originally designed. Had it instead executed on the first day of the month (i.e. the very next day), using the latest available data, it would be one of our worst performing, down -10.0% (b/c it would have taken an entirely different position).
There’s no reason to think that there’s so much magic in that month-end data point to justify that differential, or that the situation couldn’t be reversed. It’s largely “timing luck”. Fortunately, Allocate Smartly can help you to diversify away this risk with portfolio tranching.
We’ve removed the timing luck stats from these results so as not to confuse the casual reader, but they’re always available to members on our Strategy Screener.
Data Dump:
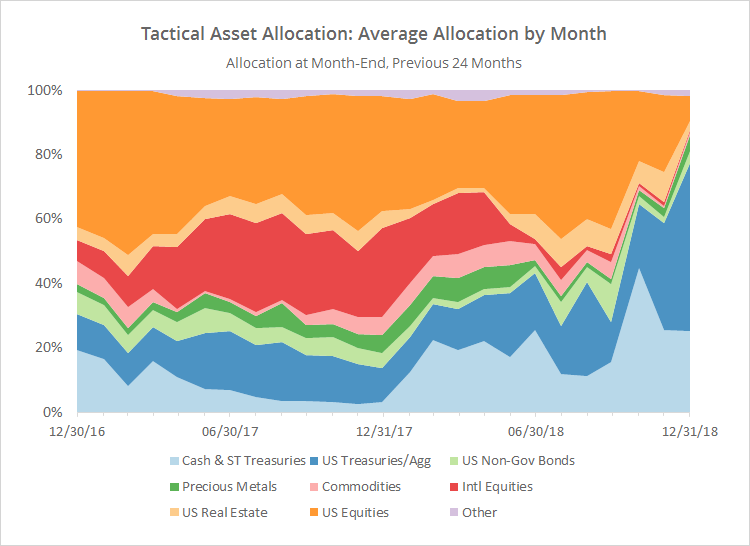
With such a large pool of published strategies to draw on (45 and counting), we’re able to draw some broad conclusions about the state of TAA. The following two charts help to show trends in the asset classes that TAA as a whole is allocating to over time.
The first chart shows the average month-end allocation to categories of assets by all of the strategies that we track. For example, “US Equities” may include everything from the S&P 500 to individual stock market sectors. Defensive assets tend to be at the bottom of the chart, and offensive at the top. The data on the far right of the chart reflects where TAA stood as of the end of the most recent month.
The biggest shift for the month was out of US equities (-16%) and real estate (-7%), and into US Treasuries (+19%).
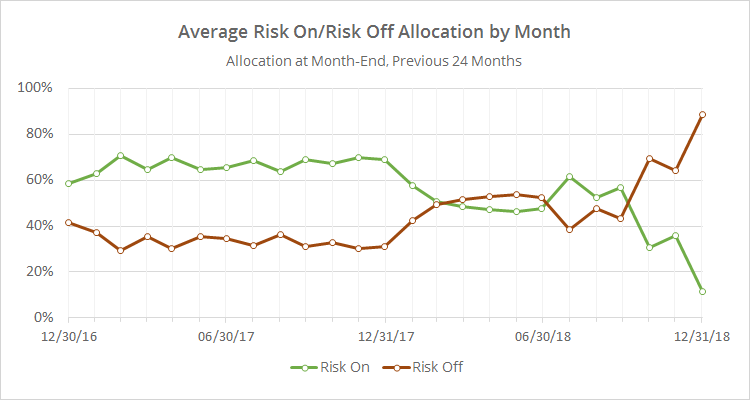
In the second chart below, we’ve combined average TAA allocation into even broader categories: “risk on” (equities, real estate and high yield bonds) versus “risk off” (everything else). We realize that some asset classes don’t fit neatly into these buckets, but it makes for a useful high level view.
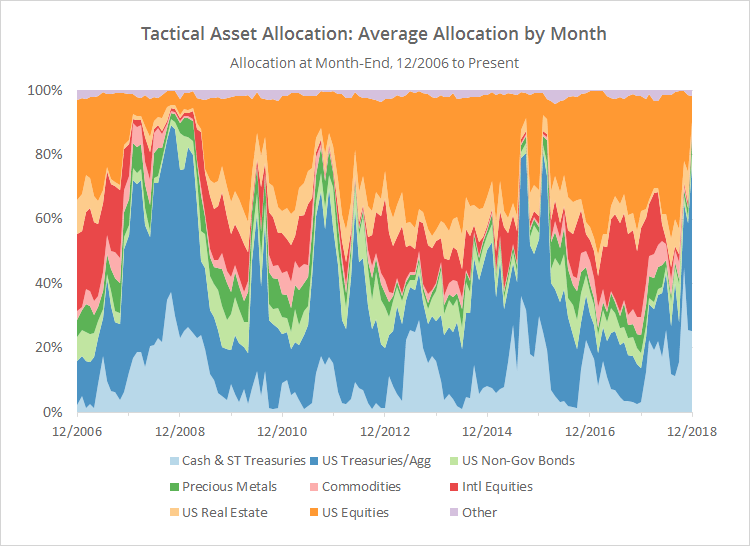
Allocation to defensive assets now stands at 88%. Those are levels not seen since the Global Financial Crisis (click for a longer view). We did get close to these levels during late 2015 and early 2016. It didn’t work out in those instances as the market quickly recovered (see previous “hero-or-zero” comments), but that won’t necessarily be the case this time. TAA tends to be more about controlling losses, as opposed to chasing big returns, so it’s unsurprising that TAA has reacted so cautiously to recent market weakness.
We invite you to become a member for about a $1 a day, or take our platform for a test drive with a free limited membership. Put the industry’s best tactical asset allocation strategies to the test, combine them into your own custom portfolio, and then track them in near real-time. Have questions? Learn more about what we do, check out our FAQs or contact us.