• Skip to primary navigation
  • Skip to main content
  • Skip to primary sidebar
  • Skip to footer

Allocate Smartly

  • About
    • What We Do
    • List of Strategies
    • Advanced Features
    • 19 Core Ideas
    • FAQs
    • Contact Us
  • Subscribe
  • Blog
  • Members

Tactical Asset Allocation in February

March 3, 2019

This is a summary of the recent performance of a wide range of excellent Tactical Asset Allocation (TAA) strategies, net of transaction costs. These strategies are sourced from books, academic papers, and other publications. While we don’t (yet) include every published TAA model, these strategies are broadly representative of the TAA space. Learn more about what we do or let AllocateSmartly help you follow these strategies in near real-time.

Recent Performance of Asset Allocation Strategies
Use the Arrows to Sort This Table
Strategy Feb YTD
Philosophical Economics’ Growth-Trend Timing 3.24% 11.51%
Accelerating Dual Momentum 3.24% 3.43%
Vigilant Asset Allocation – Balanced 2.03% 2.49%
Faber’s Ivy Portfolio 1.78% 8.75%
60/40 Benchmark 1.73% 6.88%
Defensive Asset Allocation 1.56% 2.84%
PortfolioCharts’ Golden Butterfly 1.13% 5.67%
Newfound’s Diversified Dual Momentum 0.76% 1.62%
US Max Sharpe 0.74% 4.57%
US Min Correlation 0.63% 5.07%
US Max Diversification 0.58% 3.56%
Dalio’s All-Weather Portfolio 0.58% 4.00%
Browne’s Permanent Portfolio 0.41% 3.29%
US Equal Risk Contribution 0.38% 4.37%
Allocate Smartly’s Meta Strategy 0.26% 1.68%
Flexible Asset Allocation 0.19% 0.59%
Robust Asset Allocation – Balanced 0.13% 0.34%
Faber’s Global Tactical Asset Alloc. 5 0.12% 0.39%
Robust Asset Allocation – Aggressive 0.11% 0.32%
Faber’s Sector Relative Strength 0.08% 0.28%
Varadi’s Percentile Channels 0.06% 0.18%
Faber’s Trinity Portfolio Lite -0.08% 2.89%
Efficiente Index -0.09% 1.28%
US Risk Parity Trend Following -0.10% 0.30%
Faber’s Global Tactical Asset Alloc. 13 -0.18% 0.44%
Composite Dual Momentum -0.30% -0.18%
Traditional Dual Momentum -0.31% 0.59%
Kipnis’ Defensive Adaptive Asset Allocation -0.35% 0.22%
Varadi’s Minimum Correlation Portfolio -0.35% 3.13%
Stoken’s Active Combined Asset -0.36% 3.92%
Stoken’s Active Combined Asset – Monthly -0.40% 3.87%
Livingston’s Mama Bear Portfolio -0.43% 0.68%
Elastic Asset Allocation – Defensive -0.45% 0.16%
Global Risk Parity Trend Following -0.47% -0.21%
Keuning’s Generalized Protective Momentum -0.49% 0.09%
Elastic Asset Allocation – Offensive -0.49% 0.15%
Livingston’s Papa Bear Portfolio -0.50% 0.87%
Faber’s Global Tactical Asset Alloc. – Agg. 3 -0.50% 0.73%
Novell’s Tactical Bond Strategy -0.57% 0.04%
Adaptive Asset Allocation -0.57% 1.13%
Classical Asset Allocation – Defensive -0.58% 0.07%
Classical Asset Allocation – Offensive -0.58% 0.07%
Protective Asset Allocation – CPR -0.59% 0.06%
Protective Asset Allocation -0.59% 0.06%
Tactical Permanent Portfolio -0.61% 0.71%
Faber’s Global Tactical Asset Alloc. – Agg. 6 -0.63% 0.61%
Davis’ Three Way Model -0.99% -0.90%
Glenn’s Paired Switching Strategy -1.38% -1.00%
Vigilant Asset Allocation – Aggressive -1.73% -1.28%

Commentary:

Tactical asset allocation has taken it on the chin so far this year.

TAA successfully sidestepped market weakness in late 2018, but entered the new year positioned too defensively for the market snap back. That has left TAA on the sidelines as risk assets have rallied to start the year.

This is looking like a collective headfake for TAA, like it experienced in late-2015 and early-2016. More on this in a moment.

As we show in the data dump below, TAA has eased off its extreme defensive posture, but remains cautious, with 63% of assets held still defensive in nature. If this market rally falters in March, TAA should weather it well. But if this rally continues, we’ll likely see a mediocre month from most strategies.

Data Dump:

With such a large pool of published strategies to draw on (49 and counting), we’re able to draw some broad conclusions about the state of TAA. The following two charts help to show trends in the asset classes that TAA as a whole is allocating to over time.

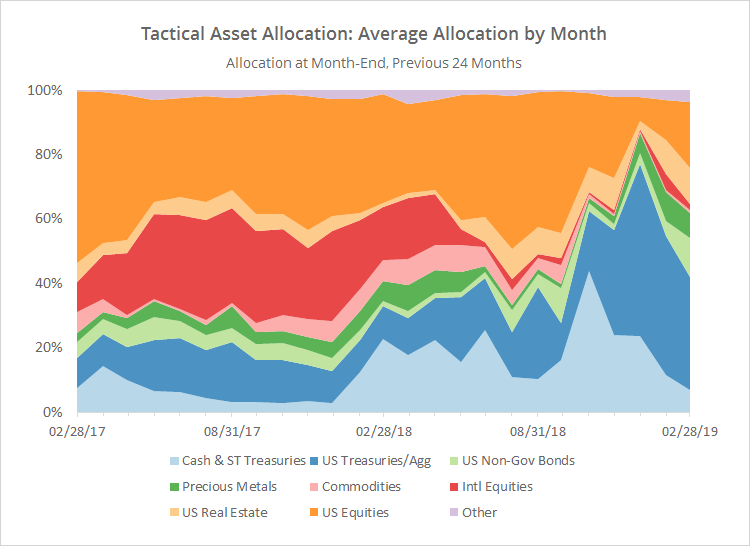
The first chart shows the average month-end allocation to categories of assets by all of the strategies that we track. For example, “US Equities” may include everything from the S&P 500 to individual stock market sectors. Defensive assets tend to be at the bottom of the chart, and offensive at the top. The data on the far right of the chart reflects where TAA stood as of the end of the most recent month.

The biggest shift for the month was out of US Treasuries (-8%) and cash (-5%) and into US equities (+8%) and US non-government bonds (+7%).


(click for a longer view)

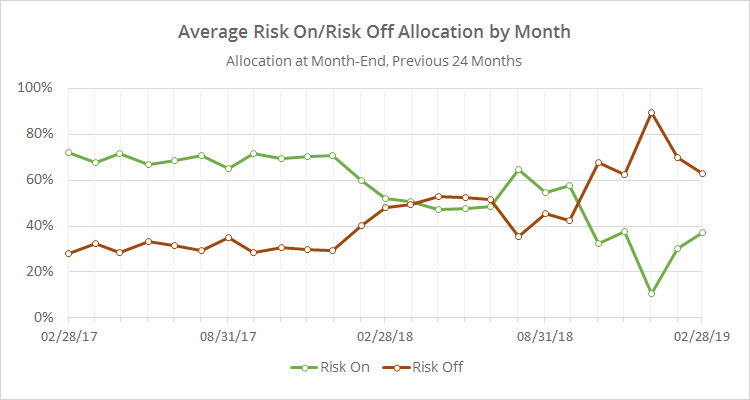
In the second chart below, we’ve combined average TAA allocation into even broader categories: “risk on” (equities, real estate and high yield bonds) versus “risk off” (everything else). We realize that some asset classes don’t fit neatly into these buckets, but it makes for a useful high level view.

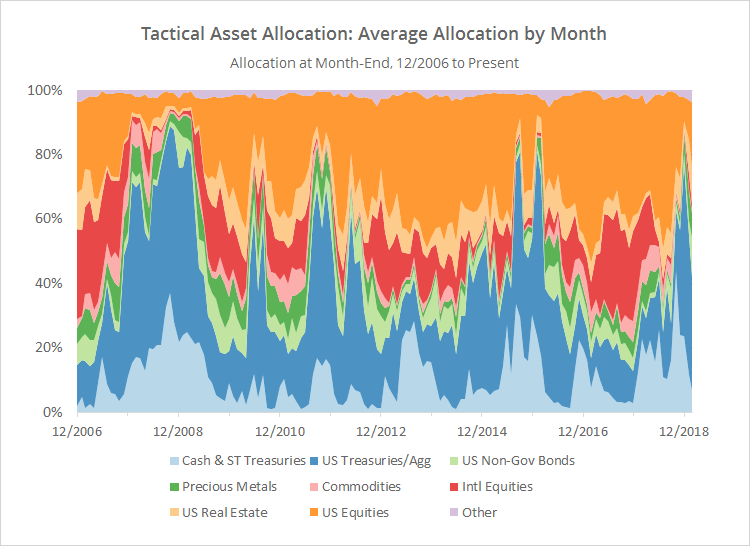
Note the continued ramping down in defensive assets. Looking at the longer view, the brief period of extreme defensiveness over the last few months looks very similar to what happened to TAA in late-2015 and early-2016. In both of those instances, TAA got “headfaked”, responding well to early market weakness, only to see the market immediately snap back.

To some degree, this is the price of doing business for trend-following/momentum types of strategies. At some point, TAA’s cautious nature is going to save the portfolio from significant loss (ex. 2000-02 and 2007-08), but in the meantime, that risk adversity makes TAA prone to getting stuck on the sidelines when those losses don’t develop.


(click for a longer view)

We invite you to become a member for about a $1 a day, or take our platform for a test drive with a free limited membership. Put the industry’s best tactical asset allocation strategies to the test, combine them into your own custom portfolio, and then track them in near real-time. Have questions? Learn more about what we do, check out our FAQs or contact us.

Filed Under: TAA Performance

Previous Post
Next Post

Primary Sidebar

About Us

We have built a platform to track the industry's best Tactical Asset Allocation strategies in near real-time, and combine them into custom portfolios.

Learn about what we do or take our platform for a free test drive.

Follow Our Blog

Recent Posts

  • Front-Running Seasonality in Country ETFs: An Extended Test
  • New Feature: Walked-Forward Optimal Strategy Combinations (aka “Meta Walk-Forwards”)
  • Walking Forward Optimal Strategy Combinations
  • Taming Excessive “Timing Luck” in TAA by Tranching Strategies
  • Piard’s Annual Seasonality

Categories

Footer

About Us

We have built a platform to track the industry's best Tactical Asset Allocation strategies in near real-time, and combine them into custom portfolios.

Learn about what we do and take our platform for a free test drive.

New from Our Blog

  • Front-Running Seasonality in Country ETFs: An Extended Test April 29, 2025
  • New Feature: Walked-Forward Optimal Strategy Combinations (aka “Meta Walk-Forwards”) April 22, 2025
  • Walking Forward Optimal Strategy Combinations March 31, 2025

Helpful Links

  • What We Do
  • List of Strategies
  • Advanced Features
  • Subscribe
  • Blog
  • FAQs
  • Contact Us
  • Member Login

Stay Informed

Follow the latest research from our blog via Twitter, RSS and email:

© 2025 Allocate Smartly. All rights reserved.
  • Affiliates
  • Terms of Service
  • Privacy