• Skip to primary navigation
  • Skip to main content
  • Skip to primary sidebar
  • Skip to footer

Allocate Smartly

  • About
    • What We Do
    • List of Strategies
    • Advanced Features
    • FAQs
    • Contact Us
  • Subscribe
  • Blog
  • Members

Tactical Asset Allocation in January

February 2, 2019

This is a summary of the recent performance of a wide range of excellent Tactical Asset Allocation (TAA) strategies, net of transaction costs. These strategies are sourced from books, academic papers, and other publications. While we don’t (yet) include every published TAA model, these strategies are broadly representative of the TAA space. Learn more about what we do or let AllocateSmartly help you follow these strategies in near real-time.

Recent Performance of Asset Allocation Strategies
Use the Arrows to Sort This Table
Strategy Jan YTD
Philosophical Economics’ Growth-Trend Timing 8.01% 8.01%
Faber’s Ivy Portfolio 6.85% 6.85%
60/40 Benchmark 5.06% 5.06%
PortfolioCharts’ Golden Butterfly 4.49% 4.49%
US Min Correlation 4.42% 4.42%
Stoken’s Active Combined Asset 4.30% 4.30%
Stoken’s Active Combined Asset – Monthly 4.29% 4.29%
US Equal Risk Contribution 3.98% 3.98%
US Max Sharpe 3.81% 3.81%
Varadi’s Minimum Correlation Portfolio 3.49% 3.49%
Dalio’s All-Weather Portfolio 3.40% 3.40%
Faber’s Trinity Portfolio Lite 2.97% 2.97%
US Max Diversification 2.96% 2.96%
Browne’s Permanent Portfolio 2.87% 2.87%
Adaptive Asset Allocation 1.72% 1.72%
Allocate Smartly’s Meta Strategy 1.40% 1.40%
Livingston’s Papa Bear Portfolio 1.38% 1.38%
Efficiente Index 1.37% 1.37%
Tactical Permanent Portfolio 1.32% 1.32%
Defensive Asset Allocation 1.26% 1.26%
Faber’s Global Tactical Asset Alloc. – Agg. 6 1.25% 1.25%
Faber’s Global Tactical Asset Alloc. – Agg. 3 1.24% 1.24%
Livingston’s Mama Bear Portfolio 1.12% 1.12%
Traditional Dual Momentum 0.91% 0.91%
Newfound’s Diversified Dual Momentum 0.85% 0.85%
Protective Asset Allocation 0.65% 0.65%
Classical Asset Allocation – Defensive 0.65% 0.65%
Classical Asset Allocation – Offensive 0.65% 0.65%
Protective Asset Allocation – CPR 0.65% 0.65%
Elastic Asset Allocation – Offensive 0.65% 0.65%
Faber’s Global Tactical Asset Alloc. 13 0.62% 0.62%
Elastic Asset Allocation – Defensive 0.62% 0.62%
Novell’s Tactical Bond Strategy 0.61% 0.61%
Keuning’s Generalized Protective Momentum 0.59% 0.59%
Vigilant Asset Allocation – Aggressive 0.45% 0.45%
Vigilant Asset Allocation – Balanced 0.45% 0.45%
Flexible Asset Allocation 0.40% 0.40%
US Risk Parity Trend Following 0.40% 0.40%
Glenn’s Paired Switching Strategy 0.38% 0.38%
Faber’s Global Tactical Asset Alloc. 5 0.27% 0.27%
Global Risk Parity Trend Following 0.26% 0.26%
Robust Asset Allocation – Balanced 0.21% 0.21%
Robust Asset Allocation – Aggressive 0.21% 0.21%
Faber’s Sector Relative Strength 0.20% 0.20%
Accelerating Dual Momentum 0.18% 0.18%
Composite Dual Momentum 0.12% 0.12%
Varadi’s Percentile Channels 0.12% 0.12%
Davis’ Three Way Model 0.10% 0.10%

Commentary:

TAA entered January positioned very defensively. Allocation to defensive assets like gold and US Treasuries stood at levels not seen since the Global Financial Crisis of 2007-08. That defensive posture was a good thing in December, with nearly all strategies outperforming the benchmark, but left TAA on the sidelines as risk assets rallied in January. TAA performance for the month was mediocre, to put it mildly.

What changes will TAA be making in February? As shown in the data dump below, TAA has eased off it’s extreme defensive posture, but 70% of assets held are still defensive in nature (on average). If this market rally falters in February, TAA should weather it well. But if this rally continues, we’ll likely see a mediocre month from most strategies.

Data Dump:

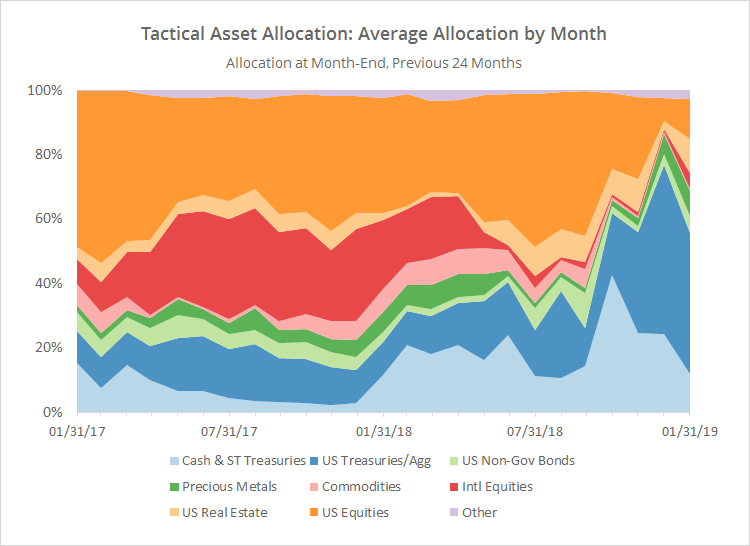
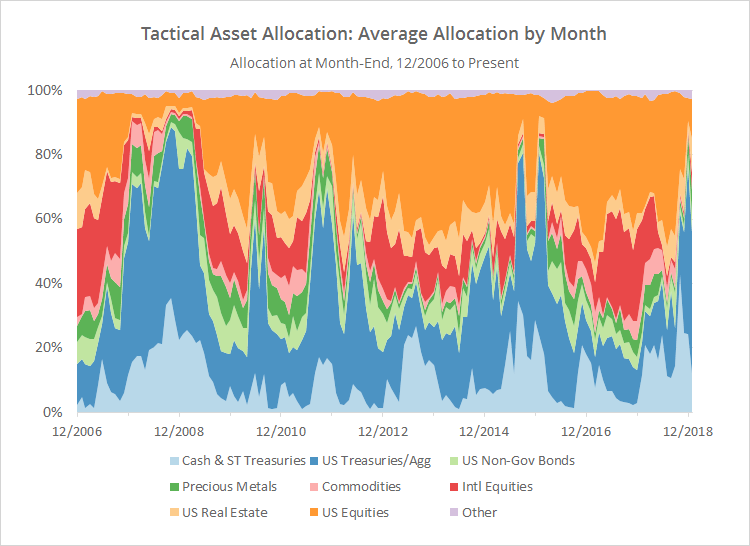
With such a large pool of published strategies to draw on (48 and counting), we’re able to draw some broad conclusions about the state of TAA. The following two charts help to show trends in the asset classes that TAA as a whole is allocating to over time.

The first chart shows the average month-end allocation to categories of assets by all of the strategies that we track. For example, “US Equities” may include everything from the S&P 500 to individual stock market sectors. Defensive assets tend to be at the bottom of the chart, and offensive at the top. The data on the far right of the chart reflects where TAA stood as of the end of the most recent month.

The biggest shift for the month was out of cash and US Treasuries (-12% and -9% respectively) and into risk assets like US real estate (+8%), US equities (+5%) and international equities (+4%).


(click for a longer view)

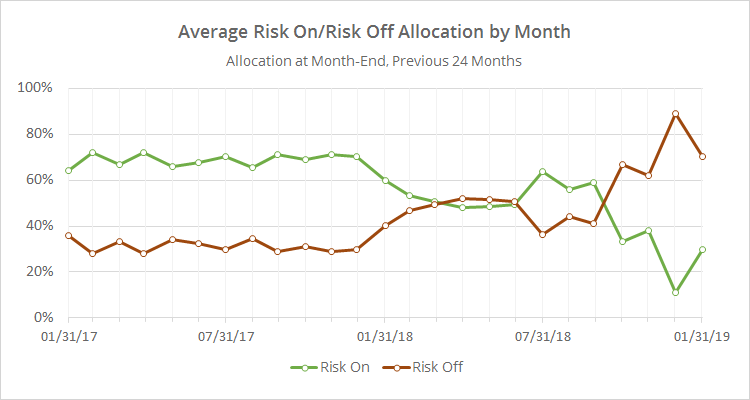
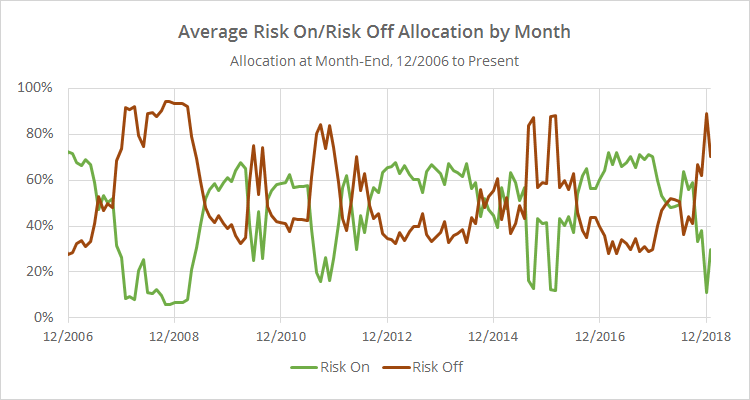
In the second chart below, we’ve combined average TAA allocation into even broader categories: “risk on” (equities, real estate and high yield bonds) versus “risk off” (everything else). We realize that some asset classes don’t fit neatly into these buckets, but it makes for a useful high level view.


(click for a longer view)

We invite you to become a member for about a $1 a day, or take our platform for a test drive with a free limited membership. Put the industry’s best tactical asset allocation strategies to the test, combine them into your own custom portfolio, and then track them in near real-time. Have questions? Learn more about what we do, check out our FAQs or contact us.

Filed Under: TAA Performance

Previous Post
Next Post

Primary Sidebar

About Us

We have built a platform to track the industry's best Tactical Asset Allocation strategies in near real-time, and combine them into custom portfolios.

Learn about what we do or take our platform for a free test drive.

Follow Our Blog

Recent Posts

  • Hybrid Asset Allocation
  • Zakamulin’s Optimal Trend Following
  • A Note About Commodities and How We Represent Them on Our Platform
  • The Best Defensive Asset Class
  • Cross-Asset Signals and Time Series Momentum

Categories

Buy & Hold More Your Speed?

Check out our sister site dedicated to building better buy & hold portfolios:

BetterBuyAndHold.com.

Footer

About Us

We have built a platform to track the industry's best Tactical Asset Allocation strategies in near real-time, and combine them into custom portfolios.

Learn about what we do and take our platform for a free test drive.

New from Our Blog

  • Hybrid Asset Allocation March 3, 2023
  • Zakamulin’s Optimal Trend Following December 19, 2022
  • A Note About Commodities and How We Represent Them on Our Platform December 6, 2022

Helpful Links

  • What We Do
  • List of Strategies
  • Advanced Features
  • Subscribe
  • Blog
  • FAQs
  • Contact Us
  • Member Login

Stay Informed

Follow the latest research from our blog via Twitter, RSS and email:

© 2023 Allocate Smartly. All rights reserved.
  • Affiliates
  • Terms of Service
  • Privacy