• Skip to primary navigation
  • Skip to main content
  • Skip to primary sidebar
  • Skip to footer

Allocate Smartly

  • About
    • What We Do
    • List of Strategies
    • Advanced Features
    • 19 Core Ideas
    • FAQs
    • Contact Us
  • Subscribe
  • Blog
  • Members

Tactical Asset Allocation in May

June 5, 2018

This is a summary of the recent performance of a wide range of excellent tactical asset allocation strategies. These strategies are sourced from books, academic papers, and other publications. While we don’t (yet) include every published TAA model, these strategies are broadly representative of the TAA space. Learn more about what we do or let AllocateSmartly help you follow these strategies in near real-time.

Recent Performance of Asset Allocation Strategies
Use the Arrows to Sort This Table
  MTD/YTD Return Adjusted for Timing Luck (*)
Strategy May YTD May YTD
Faber’s Global Tactical Asset Alloc. – Agg. 3 4.09% 5.94% 3.12% 3.70%
Faber’s Sector Relative Strength 3.92% 4.39% 3.77% 4.44%
Keuning’s Generalized Protective Momentum 2.47% 3.80% 1.88% 3.37%
Philosophical Economics’ Growth-Trend Timing 2.43% 1.93% 2.43% 1.93%
US Max Sharpe 2.20% -1.15% 2.17% -0.62%
Faber’s Global Tactical Asset Alloc. – Agg. 6 2.20% 3.52% 1.51% 1.80%
Glenn’s Paired Switching Strategy 2.00% 1.31% 0.33% -0.70%
US Risk Parity Trend Following 1.91% 3.21% 1.76% 2.30%
Elastic Asset Allocation – Offensive 1.90% 1.06% 2.24% 1.34%
PortfolioCharts’ Golden Butterfly 1.87% 0.53% 1.87% 0.53%
60/40 Benchmark 1.85% 0.34% 1.85% 0.34%
Dalio’s All-Weather Portfolio 1.79% -0.60% 1.79% -0.60%
US Min Correlation 1.58% -1.03% 1.57% -1.26%
Protective Asset Allocation 1.56% 3.27% 1.53% 2.49%
Faber’s Ivy Portfolio 1.56% 0.59% 1.56% 0.59%
US Max Diversification 1.45% -0.64% 1.45% -0.73%
US Equal Risk Contribution 1.42% -1.73% 1.44% -1.82%
Elastic Asset Allocation – Defensive 1.17% 0.30% 1.39% 0.65%
Protective Asset Allocation – CPR 1.15% 3.58% 1.03% 2.62%
Varadi’s Minimum Correlation Portfolio 1.15% -0.70% 1.13% -0.93%
Classical Asset Allocation – Offensive 1.13% 2.28% 0.60% 1.47%
Classical Asset Allocation – Defensive 0.93% 0.95% 0.96% 1.94%
Varadi’s Percentile Channels 0.84% 0.73% 0.73% -0.21%
Browne’s Permanent Portfolio 0.83% -0.36% 0.83% -0.36%
Stoken’s Active Combined Asset 0.75% -5.21% 0.75% -5.21%
Stoken’s Active Combined Asset – Monthly 0.74% -0.93% 0.75% -1.90%
Faber’s Global Tactical Asset Alloc. 5 0.67% 1.21% 0.69% 0.98%
Davis’ Three Way Model 0.62% -1.83% 0.62% -2.00%
Robust Asset Allocation – Balanced 0.40% 0.71% 0.40% 0.54%
Allocate Smartly’s Meta Strategy 0.37% 1.39% 0.37% 1.39%
Flexible Asset Allocation 0.28% 1.89% 0.71% 1.00%
Faber’s Global Tactical Asset Alloc. 13 0.26% 0.11% 0.38% -0.21%
Vigilant Asset Allocation 0.06% 8.70% 0.11% 1.74%
Tactical Permanent Portfolio 0.05% 1.08% 0.05% -0.52%
Novell’s Tactical Bond Strategy 0.03% -2.72% -0.05% -2.92%
Global Risk Parity Trend Following -0.09% -0.57% 0.04% 0.02%
Robust Asset Allocation – Aggressive -0.25% 0.22% -0.25% 0.15%
Efficiente Index -0.25% -0.01% 0.39% 0.28%
Faber’s Trinity Portfolio Lite -0.42% -0.76% -0.33% -0.82%
Composite Dual Momentum -0.79% -4.29% -0.08% -2.78%
Adaptive Asset Allocation -1.14% 4.20% -1.44% 2.45%
Traditional Dual Momentum -2.09% -1.49% -0.07% -1.52%
(*) “Timing Luck” describes the randomness that is introduced simply by the day of the month that an investor chooses to trade a monthly strategy. We believe that these adjusted figures are a more useful representation of the recent “health” of each strategy (read more and more).

Commentary:

As a whole, tactical asset allocation underperformed the US 60/40 benchmark in May. US equities and bonds (the components of the 60/40 benchmark) were both particularly strong for the month, and most other asset choices failed to keep pace. Such is the double-edged sword of diversification – it almost always works over the long-term, but frequently doesn’t work in the short-term.

International equities, both developed (EFA -1.89%) and emerging (EEM -2.62%), were especially weak. Most of the strategies that we track employ some variation of trend-following/momentum, so it’s unsurprising given this recent underperformance that TAA made a big shift away from international exposure by month-end. See the data dump below.

Data Dump:

With such a large pool of published strategies to draw on (42 and counting), we’re able to draw some broad conclusions about the state of TAA. The following two charts help to show trends in the asset classes that TAA as a whole is allocating to over time.

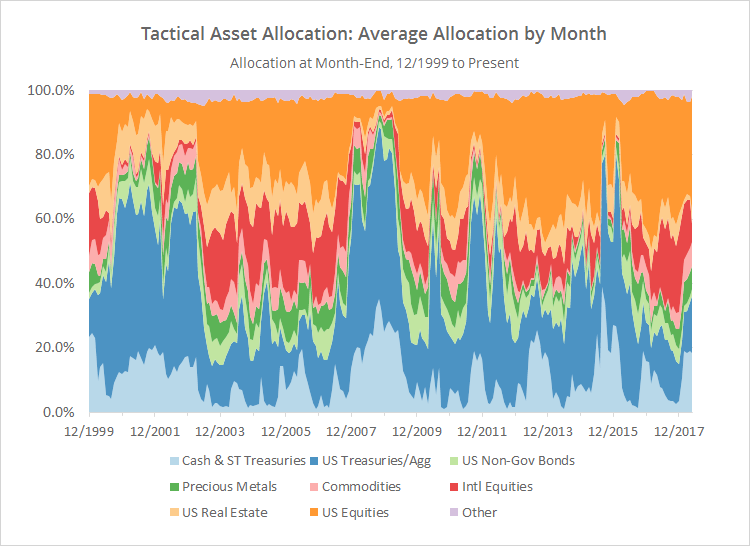
The first chart shows the average month-end allocation to categories of assets by all of the strategies that we track. For example, “US Equities” may include everything from the S&P 500 to individual stock market sectors. Defensive assets tend to be at the bottom of the chart, and offensive at the top. The data on the far right of the chart reflects where TAA stood as of the end of the most recent month.

Note how international equity exposure (dark red) has fallen from a recent high of 25% to start the year, to less than 6% today.


(click for a longer view)

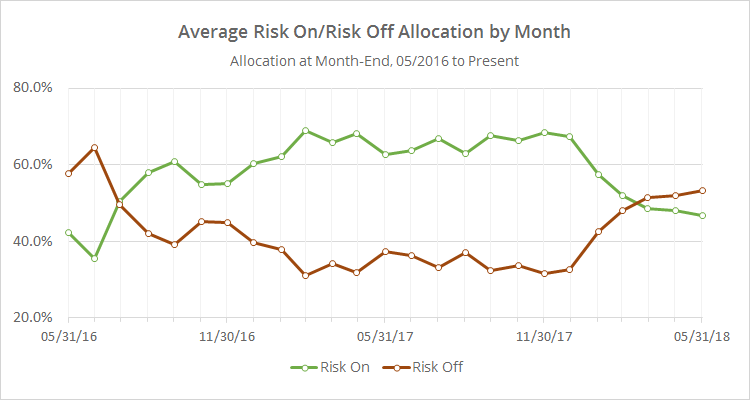
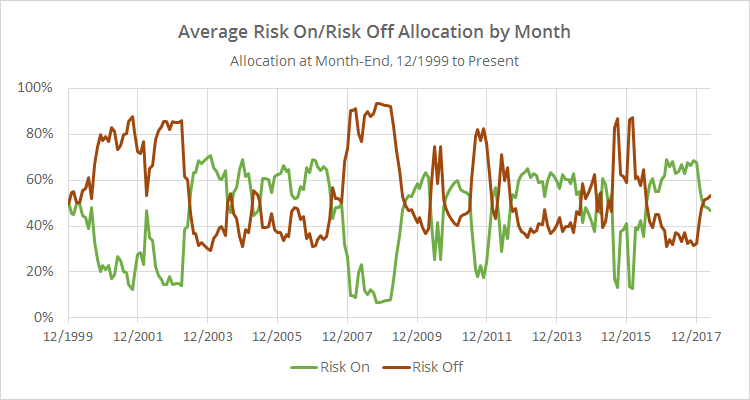
In the second chart below, we’ve combined average TAA allocation into even broader categories: “risk on” (equities, real estate and high yield bonds) versus “risk off” (everything else). We realize that some asset classes don’t fit neatly into these buckets, but it makes for a useful high level view.

This chart shows that allocation to defensive assets continues to slowly ratchet up. An even longer view shows that we’re nowhere near historical highs, but TAA is signalling a bit of caution towards this market.


(click for a longer view)

We invite you to become a member for about a $1 a day, or take our platform for a test drive with a free limited membership. Put the industry’s best tactical asset allocation strategies to the test, combine them into your own custom portfolio, and then track them in near real-time. Have questions? Learn more about what we do, check out our FAQs or contact us.

Filed Under: TAA Performance

Previous Post
Next Post

Primary Sidebar

About Us

We have built a platform to track the industry's best Tactical Asset Allocation strategies in near real-time, and combine them into custom portfolios.

Learn about what we do or take our platform for a free test drive.

Follow Our Blog

Recent Posts

  • Cliff Smith’s BKLN Strategy
  • Front-Running Seasonality in Country ETFs: An Extended Test
  • New Feature: Walked-Forward Optimal Strategy Combinations (aka “Meta Walk-Forwards”)
  • Walking Forward Optimal Strategy Combinations
  • Taming Excessive “Timing Luck” in TAA by Tranching Strategies

Categories

Footer

About Us

We have built a platform to track the industry's best Tactical Asset Allocation strategies in near real-time, and combine them into custom portfolios.

Learn about what we do and take our platform for a free test drive.

New from Our Blog

  • Cliff Smith’s BKLN Strategy May 21, 2025
  • Front-Running Seasonality in Country ETFs: An Extended Test April 29, 2025
  • New Feature: Walked-Forward Optimal Strategy Combinations (aka “Meta Walk-Forwards”) April 22, 2025

Helpful Links

  • What We Do
  • List of Strategies
  • Advanced Features
  • Subscribe
  • Blog
  • FAQs
  • Contact Us
  • Member Login

Stay Informed

Follow the latest research from our blog via Twitter, RSS and email:

© 2025 Allocate Smartly. All rights reserved.
  • Affiliates
  • Terms of Service
  • Privacy