This is a summary of the recent performance of a wide range of excellent tactical asset allocation strategies, net of transaction costs. These strategies are sourced from books, academic papers, and other publications. While we don’t (yet) include every published TAA model, these strategies are broadly representative of the TAA space. Learn more about what we do or let AllocateSmartly help you follow these strategies in near real-time.
| Recent Performance of Asset Allocation Strategies Use the Arrows to Sort This Table |
||||
|---|---|---|---|---|
| MTD/YTD Return | Adjusted for Timing Luck (*) | |||
| Strategy | Oct | YTD | Oct | YTD |
| Novell’s Tactical Bond Strategy | -0.52% | -3.74% | -0.99% | -4.53% |
| Protective Asset Allocation – CPR | -0.87% | 3.53% | -0.57% | 2.93% |
| Keuning’s Generalized Protective Momentum | -1.24% | 3.86% | -1.25% | 3.23% |
| Protective Asset Allocation | -1.31% | 1.25% | -1.05% | 1.14% |
| Global Risk Parity Trend Following | -1.57% | -1.20% | -1.86% | -1.04% |
| Browne’s Permanent Portfolio | -2.08% | -2.81% | -2.08% | -2.81% |
| Vigilant Asset Allocation – Aggressive | -2.15% | 8.18% | -0.65% | 0.89% |
| Defensive Asset Allocation | -2.15% | 2.68% | -1.10% | 0.71% |
| Vigilant Asset Allocation – Balanced | -2.15% | 1.23% | -0.75% | -1.23% |
| US Equal Risk Contribution | -2.49% | -2.15% | -2.44% | -2.25% |
| US Max Diversification | -2.54% | -1.01% | -2.46% | -1.10% |
| Composite Dual Momentum | -2.70% | -4.05% | -2.64% | -3.00% |
| Faber’s Global Tactical Asset Alloc. 13 | -2.76% | -0.99% | -2.72% | -1.38% |
| US Min Correlation | -2.96% | -1.29% | -2.87% | -1.68% |
| Faber’s Global Tactical Asset Alloc. 5 | -3.05% | 0.04% | -3.10% | -0.43% |
| Flexible Asset Allocation | -3.27% | 0.15% | -4.13% | -3.20% |
| PortfolioCharts’ Golden Butterfly | -3.55% | -3.00% | -3.55% | -3.00% |
| Robust Asset Allocation – Balanced | -3.58% | -1.57% | -3.42% | -1.52% |
| Faber’s Trinity Portfolio Lite | -3.63% | -3.61% | -3.67% | -3.84% |
| Dalio’s All-Weather Portfolio | -3.74% | -3.47% | -3.74% | -3.47% |
| Allocate Smartly’s Meta Strategy | -3.92% | -0.70% | -3.92% | -0.70% |
| US Risk Parity Trend Following | -4.05% | 0.60% | -3.70% | 0.24% |
| Robust Asset Allocation – Aggressive | -4.19% | -1.66% | -3.92% | -1.35% |
| Classical Asset Allocation – Defensive | -4.21% | 1.40% | -4.20% | 1.98% |
| Stoken’s Active Combined Asset – Monthly | -4.26% | -4.64% | -4.24% | -5.88% |
| Varadi’s Minimum Correlation Portfolio | -4.27% | -6.72% | -4.30% | -7.10% |
| 60/40 Benchmark | -4.27% | 0.56% | -4.27% | 0.56% |
| Stoken’s Active Combined Asset | -4.33% | -8.20% | -4.33% | -8.20% |
| Elastic Asset Allocation – Defensive | -4.80% | -2.07% | -4.38% | -0.61% |
| Faber’s Ivy Portfolio | -4.85% | -2.01% | -4.85% | -2.01% |
| Efficiente Index | -5.39% | -4.29% | -4.44% | -3.80% |
| Varadi’s Percentile Channels | -5.79% | -2.90% | -4.96% | -3.28% |
| US Max Sharpe | -5.96% | -1.24% | -6.05% | -0.88% |
| Elastic Asset Allocation – Offensive | -6.15% | -1.53% | -5.23% | 0.54% |
| Classical Asset Allocation – Offensive | -6.68% | -2.29% | -6.18% | -1.57% |
| Adaptive Asset Allocation | -6.87% | -5.01% | -4.15% | -5.04% |
| Tactical Permanent Portfolio | -6.88% | -1.89% | -6.67% | -3.96% |
| Philosophical Economics’ Growth-Trend Timing | -6.91% | 2.74% | -6.91% | 2.74% |
| Glenn’s Paired Switching Strategy | -6.91% | 1.98% | -7.35% | -1.02% |
| Traditional Dual Momentum | -6.91% | -0.71% | -6.91% | -0.80% |
| Davis’ Three Way Model | -6.91% | -3.21% | -6.49% | -5.64% |
| Accelerating Dual Momentum | -7.10% | -1.74% | -6.98% | -1.61% |
| Faber’s Global Tactical Asset Alloc. – Agg. 6 | -7.32% | -0.65% | -6.67% | -2.18% |
| Faber’s Sector Relative Strength | -8.39% | 2.45% | -8.69% | 2.85% |
| Faber’s Global Tactical Asset Alloc. – Agg. 3 | -8.94% | -1.07% | -9.12% | -3.57% |
Commentary:
 Here’s an understatement: October was uuuuugly for risk asset classes.
There was a wide disparity in TAA strategy results depending on their risk posture to start the month. Results ranged from down a smidge to full blown nose dive into the void. Not to beat a dead horse, but this is a good illustration of the need to diversify across strategies (something our platform was specifically built for).
The important question of course, is where we go from here. As we show in the data dump below, TAA has done what one would expect, and shifted to a much more defensive posture. This is a real hero-or-zero moment for TAA. If the market sees a quick bounce back in November, TAA is going to be left too defensive and trailing the recovery. If the market continues to falter, TAA is going to be well positioned to weather the storm.
Data Dump:
With such a large pool of published strategies to draw on (45 and counting), we’re able to draw some broad conclusions about the state of TAA. The following two charts help to show trends in the asset classes that TAA as a whole is allocating to over time.
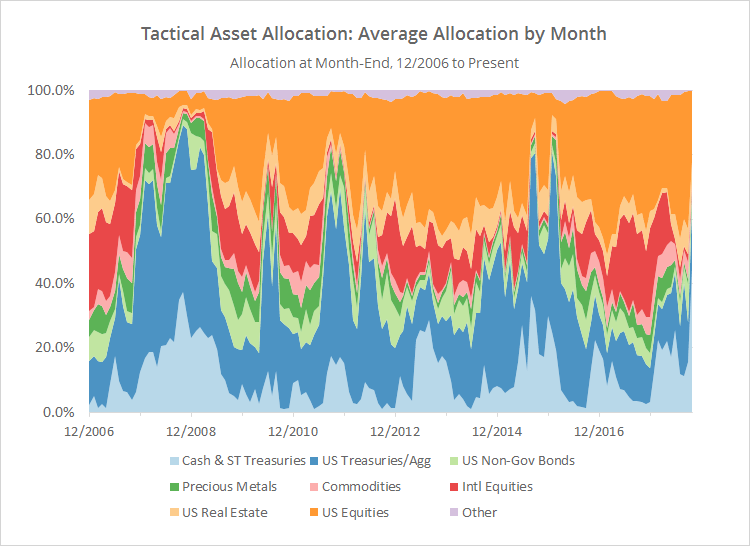
The first chart shows the average month-end allocation to categories of assets by all of the strategies that we track. For example, “US Equities” may include everything from the S&P 500 to individual stock market sectors. Defensive assets tend to be at the bottom of the chart, and offensive at the top. The data on the far right of the chart reflects where TAA stood as of the end of the most recent month.
Note the rotation out of risk asset classes, particularly US equities (from 42.9% to 21.9%). By far, the biggest recipient of that allocation was Cash and Short-Term US Treasuries (from 15.5% to 44.9%). Given the recent weakness in longer-term US Treasuries, many strategies are opting for shorter duration alternatives as their defensive asset of choice. Cash and Short-Term US Treasuries now stands at it highest level since 1981 (wow).

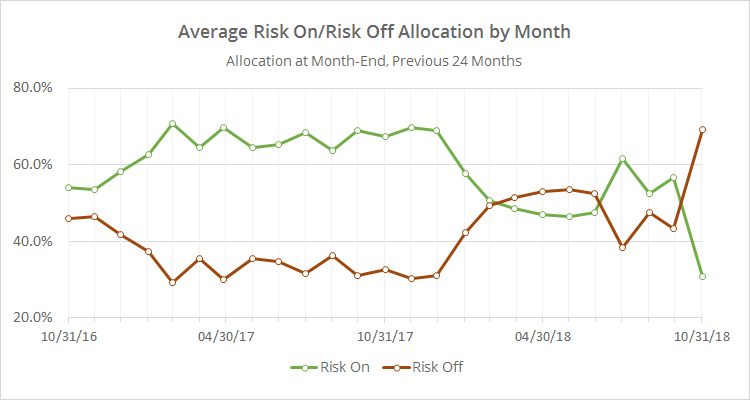
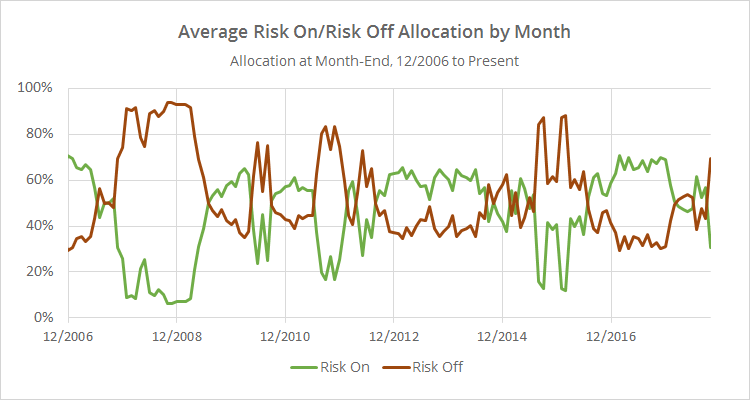
In the second chart below, we’ve combined average TAA allocation into even broader categories: “risk on” (equities, real estate and high yield bonds) versus “risk off” (everything else). We realize that some asset classes don’t fit neatly into these buckets, but it makes for a useful high level view.
This chart shows the rotation into defensive assets more clearly. Note however, that we’re a long way from historical highs (click for a longer view). We were at a much higher level of defensive exposure as recently as early-2016. It didn’t work out that time as the market quickly recovered (see previous “hero-or-zero” comments), but that won’t necessarily be the case this time. TAA tends to be more about controlling losses, as opposed to chasing big returns, so it’s unsurprising that TAA has reacted so cautiously.
We invite you to become a member for about a $1 a day, or take our platform for a test drive with a free limited membership. Put the industry’s best tactical asset allocation strategies to the test, combine them into your own custom portfolio, and then track them in near real-time. Have questions? Learn more about what we do, check out our FAQs or contact us.