This is a summary of the recent performance of a wide range of excellent tactical asset allocation strategies. These strategies are sourced from books, academic papers, and other publications. While we don’t (yet) include every published TAA model, these strategies are broadly representative of the TAA space. Read more about our backtests or let AllocateSmartly help you follow these strategies in near real-time.
Commentary:
 Tactical asset allocation turned in another solid performance in May, with positive results nearly across the board. The two top performing strategies were only recently added to the members’ section: Classical Asset Allocation (CAA) Defensive and Offensive.
A note about our site philosophy: A strategy’s recent performance plays no role in whether it’s added to our site; only it’s ability to represent tactical asset allocation matters. Long-time members know that we add strategies showing recent strength and recent weakness with equal frequency. Put another way, we don’t cherry pick here.
The CAA models come from the paper: Momentum & Markowitz: A Golden Combination, by Dr. Wouter Keller, Adam Butler of GestaltU/Resolve AM and Ilya Kipnis of the blog QuantStrat TradeR. We’ll be introducing Classical Asset Allocation in more detail here on our blog in the coming week.
The top performing significant asset classes for the month were mostly related to international risk exposure, notably Europe equities (VGK, +4.91%), developed international equities (EFA, +3.54%) and emerging market equities (EEM, +2.85%). Notable laggards were US small caps (IWM -1.97%, and IWN -3.06%).
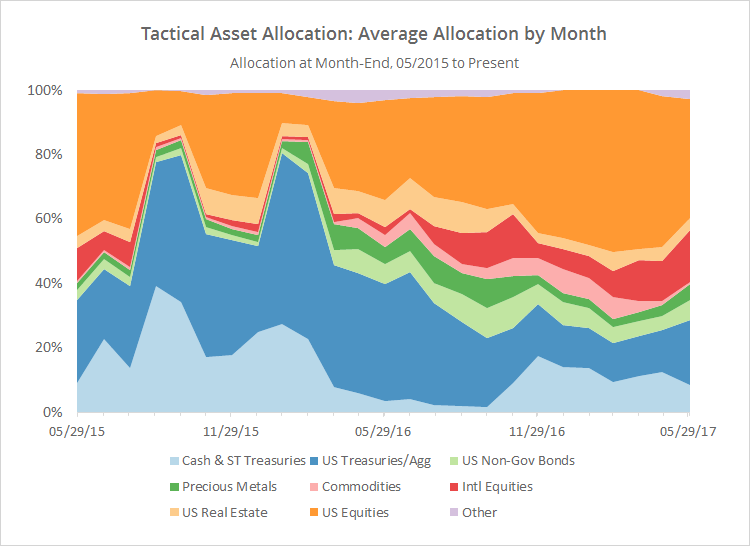
The charts below help to show trends in the asset classes that TAA is allocating to over time. The first chart shows the average allocation over the last two years to broad categories of assets by the 37 strategies that we track, as of the end of each month (for a longer view, see this post). For example, “US Equities” may include everything from the S&P 500 to individual stock market sectors.
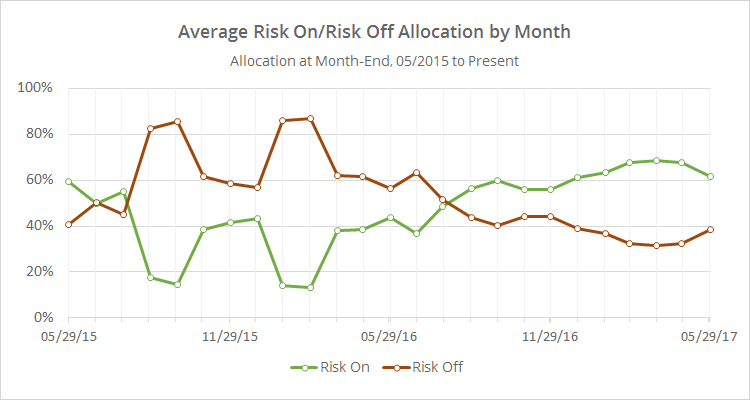
Below we’ve combined the average TAA allocation into even broader categories: “risk on” (equities, real estate and high yield bonds) versus “risk off” (everything else). I realize that some asset classes don’t fit neatly into these buckets, but it makes for a useful high level view.
The big takeaway from these graphs is that exposure to risk assets has, for the first time since October of last year, fallen (albeit not by much). The biggest reason for the decline is rotation out of US equities. Looking even further into history though, tactical asset allocation’s exposure to risk assets still remains relatively high. That’s great if this broad rally continues, but there is significant exposure to investors here if the market stumbles in June.
We invite you to become a member for less than $1 a day or take our platform for a test drive with a free limited membership. Track the industry’s best tactical asset allocation strategies in near real-time, and combine them into custom portfolios. Have questions? Learn more about what we do, check out our FAQs or contact us.