• Skip to primary navigation
  • Skip to main content
  • Skip to primary sidebar
  • Skip to footer

Allocate Smartly

  • About
    • What We Do
    • List of Strategies
    • Advanced Features
    • 19 Core Ideas
    • FAQs
    • Contact Us
  • Subscribe
  • Blog
  • Members

Tactical Asset Allocation in November

December 1, 2016

This is a summary of the recent performance of a number of excellent tactical asset allocation strategies. These strategies are sourced from books, academic papers, and other publications. While we don’t (yet) include every published TAA model, these strategies are broadly representative of the TAA space. Read more about our backtests or let AllocateSmartly help you follow these strategies in near real-time.

Recent Performance of Asset Allocation Strategies
Use the Arrows to Sort This Table
Strategy Month YTD
Faber’s Global Tactical Asset Alloc. – Agg. 3 4.73% 4.99%
Traditional Dual Momentum 3.68% 4.34%
Glenn’s Paired Switching Strategy 3.68% -0.25%
Faber’s Sector Relative Strength 2.79% -3.86%
Faber’s Global Tactical Asset Alloc. – Agg. 6 2.01% 7.01%
Faber’s Global Tactical Asset Alloc. 5 0.71% 2.18%
60/40 Benchmark 0.52% 6.47%
Robust Asset Allocation – Aggressive 0.35% 1.62%
Varadi’s Percentile Channels 0.09% 3.47%
Flexible Asset Allocation -0.30% -0.69%
Faber’s Ivy Portfolio -0.42% 5.41%
Robust Asset Allocation – Balanced -0.47% 0.21%
Faber’s Global Tactical Asset Alloc. 13 -0.58% 3.58%
Stoken’s Active Combined Asset -1.45% 3.35%
Composite Dual Momentum -1.66% -2.29%
Elastic Asset Allocation – Offensive -2.05% -0.72%
Elastic Asset Allocation – Defensive -2.07% 1.07%
Adaptive Asset Allocation -2.11% 1.25%
Protective Asset Allocation -2.50% 2.46%
Dalio’s All-Weather Portfolio -3.43% 5.56%
Browne’s Permanent Portfolio -3.48% 5.46%
Davis’ Three Way Model -4.42% -3.34%
Varadi’s Minimum Correlation Portfolio -4.48% 7.26%

Commentary:

There was a wider-than-usual disparity in the performance of significant asset classes in November. Essentially anything related to US equities was strong, including the S&P 500 (represented by SPY, +3.7%) and Russell 2000 small-caps (IWM, +11.1%). Most asset classes however were down for the month, particularly gold (GLD, -8.4%), long-term US Treasuries (TLT, -8.2%) and emerging markets (EEM, -4.4%).

A number of the more aggressive strategies that we track capitalized on those strong US equity returns. It was the more cautious strategies, that lay bets across more traditionally defensive assets like Treasuries and gold, that struggled for the month.

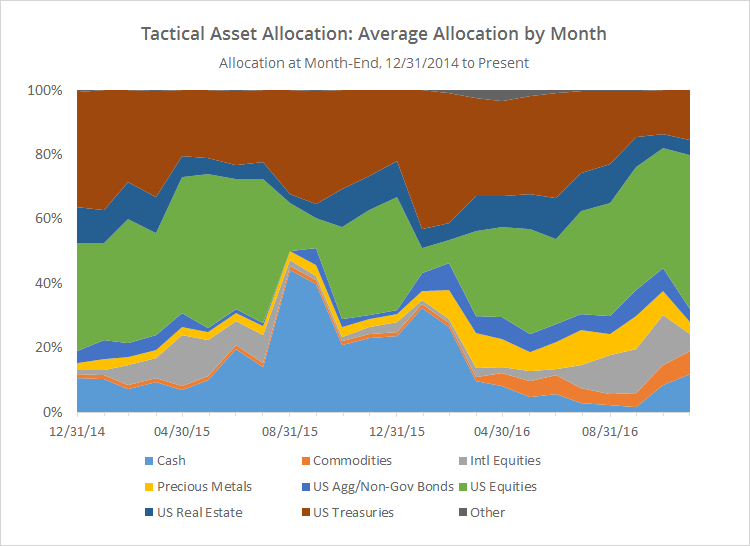
The strategies have, as a whole, responded by increasing allocation to US equities. The chart below shows the average allocation to broad categories of assets by the 23 strategies that we track, as of the end of each month since EO’2014. Note that allocation to US equities (green) has reached a sample high of 48%. In other words, on average, the strategies that we track are currently nearly half allocated to some flavor of US equities.

20161201-01

Despite these recent changes to allocation however, the overall exposure to risk on/risk off assets has remained essentially the same over the last four months. To illustrate, below I’ve combined asset classes into even broader categories: “risk on” (equities, real estate and high yield bonds) versus “risk off” (everything else). I realize that some asset classes don’t fit neatly into these buckets, but it makes for a useful high level view.

20161201-02

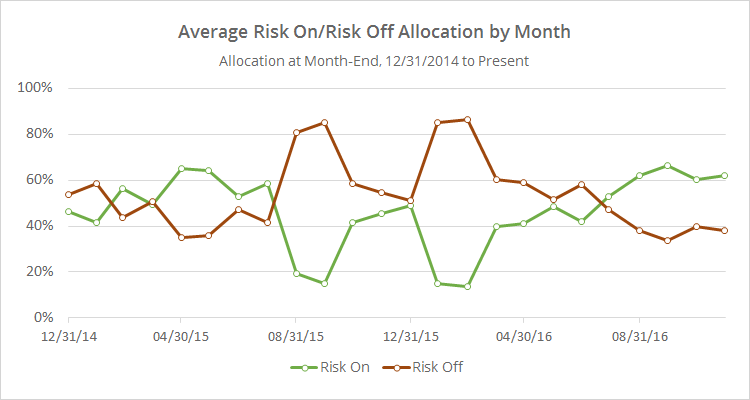
As previously mentioned, while we don’t (yet) track every published tactical asset allocation model, the 23 strategies that we do track are broadly representative of the TAA space, and I think it’s fair to draw some broader conclusions from this data. Tactical asset allocation overall remains bullish on risk, but there is significant exposure to investors here if the market softens in December.

Coming soon:

Many of the strategies that we track are related to some flavor of momentum trading. We want to make sure that we’re maintaining balance on this site, so we’ll be adding a suite of very different strategies focused on portfolio optimization techniques: Min Variance, Min Correlation, Max Diversification, Equal Risk Contribution and Max Sharpe. Be on the lookout for these new strategies over the next week.

Filed Under: TAA Performance

Previous Post
Next Post

Primary Sidebar

About Us

We have built a platform to track the industry's best Tactical Asset Allocation strategies in near real-time, and combine them into custom portfolios.

Learn about what we do or take our platform for a free test drive.

Follow Our Blog

Recent Posts

  • Front-Running Seasonality in Country ETFs: An Extended Test
  • New Feature: Walked-Forward Optimal Strategy Combinations (aka “Meta Walk-Forwards”)
  • Walking Forward Optimal Strategy Combinations
  • Taming Excessive “Timing Luck” in TAA by Tranching Strategies
  • Piard’s Annual Seasonality

Categories

Footer

About Us

We have built a platform to track the industry's best Tactical Asset Allocation strategies in near real-time, and combine them into custom portfolios.

Learn about what we do and take our platform for a free test drive.

New from Our Blog

  • Front-Running Seasonality in Country ETFs: An Extended Test April 29, 2025
  • New Feature: Walked-Forward Optimal Strategy Combinations (aka “Meta Walk-Forwards”) April 22, 2025
  • Walking Forward Optimal Strategy Combinations March 31, 2025

Helpful Links

  • What We Do
  • List of Strategies
  • Advanced Features
  • Subscribe
  • Blog
  • FAQs
  • Contact Us
  • Member Login

Stay Informed

Follow the latest research from our blog via Twitter, RSS and email:

© 2025 Allocate Smartly. All rights reserved.
  • Affiliates
  • Terms of Service
  • Privacy