This is a summary of the recent performance of a wide range of excellent tactical asset allocation strategies. These strategies are sourced from books, academic papers, and other publications. While we don’t (yet) include every published TAA model, these strategies are broadly representative of the TAA space. Learn more about what we do or let AllocateSmartly help you follow these strategies in near real-time.
Adjusting for “Timing Luck”:
 The short-version: The adjusted figures are a more useful representation of each strategy’s true recent performance.
The slightly longer version: Most of the TAA strategies that we track are designed to trade once per month (at the close on the last trading day of the month). That’s because: (a) monthly asset class data is often available much further into the past than daily data, allowing for longer backtests, and (b) TAA is by its nature designed to ignore day-to-day noise, so trading too frequently is often counterproductive.
Trading the exact same strategy on days other than month-end can often lead to very different results (read more). “Timing luck” describes this randomness that is introduced simply by the day chosen to trade. Over the long-term there may be exploitable advantages to trading during certain periods of the month, particularly around the turn of the month (read more), but in any single month, timing luck is mostly meaningless noise. So to better measure each strategy’s true short-term performance we now provide both a “raw” MTD/YTD return (trading at month-end) as well as a MTD/YTD return that has been adjusted for timing luck.
This adjusted figure is simply the average return of variations of the strategy trading on all other possible trading days. You can find more on the math behind this test here, but for now, know that we always maintain the spirit of the original strategy. If trading mid-month for example, we use previous mid-month prices to perform strategy calculations. We are not simply delaying the day of execution.
If that was confusing, don’t worry. The key takeaway is that the adjusted MTD/YTD figures are a more useful representation of each strategy’s true recent performance, and likely more relevant to the “health” of each strategy.
Commentary:
Tactical asset allocation turned in a mixed performance in September, with a large gap between the top and bottom performing strategies. While most risk asset classes were up for the month, especially anything related to US small caps (ex. IWM +6.3% and IWN +7.2%), most “risk off” assets were down, notably gold (GLD -3.4%) and anything related to treasuries, both US (ex. TLT -2.3%) and international (BWX -1.9%).
With such a large pool of published strategies to draw on (40 and counting), we’re able to draw some broad conclusions about the state of TAA. The following two charts help to show trends in the asset classes that TAA as a whole is allocating to over time. Members note that you can now see this information updated daily with your new Aggregate Asset Allocation report.
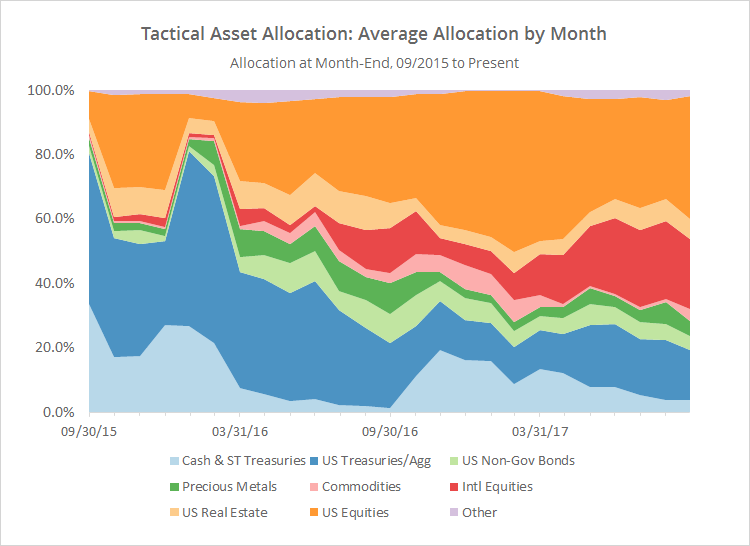
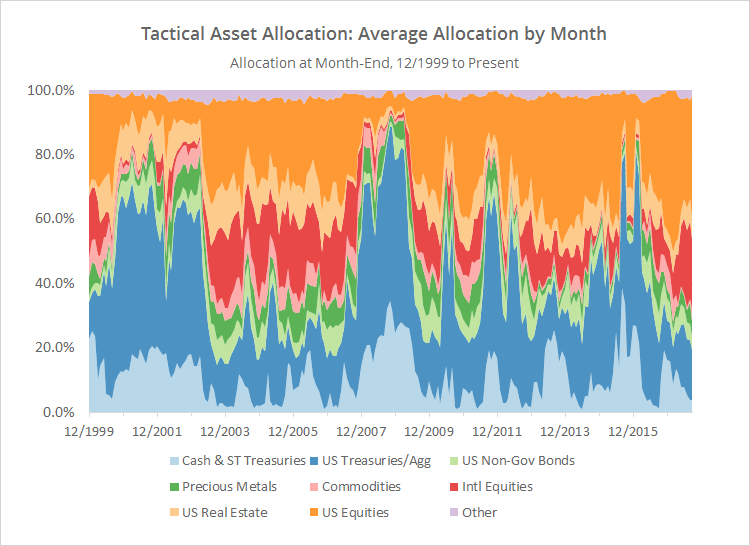
The first chart shows the average month-end allocation to categories of assets by all of the strategies that we track (click for a longer view). For example, “US Equities” may include everything from the S&P 500 to individual stock market sectors.
Important takeaways from this chart: TAA’s exposure to defensive assets like cash (light blue) and US Treasuries (dark blue) is at it’s lowest point since early 2007. Exposure to international equities (red) has dropped a bit, but remains high.
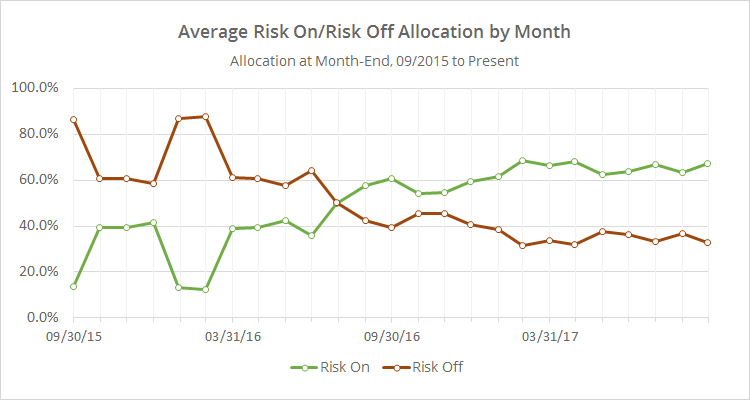
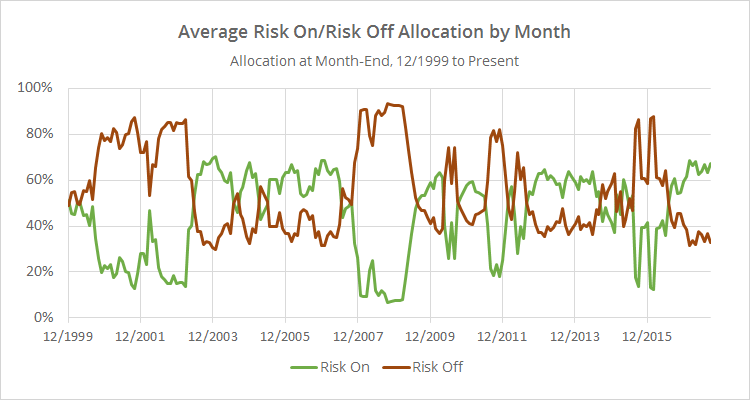
In the second chart below, we’ve combined average TAA allocation into even broader categories: “risk on” (equities, real estate and high yield bonds) versus “risk off” (everything else). I realize that some asset classes don’t fit neatly into these buckets, but it makes for a useful high level view.
This chart shows that overall allocation to risk assets remains elevated. The last time TAA’s exposure to risk assets stood at these levels was way back in 2007, about 6 months prior to the onset of the Global Financial Crisis (click for a longer view). That’s a good thing if this broad rally continues, but it means that there remains significant exposure to investors here if the market stumbles in October.
We invite you to become a member for about a $1 a day, or take our platform for a test drive with a free limited membership. Put the industry’s best tactical asset allocation strategies to the test, combine them into your own custom portfolio, and then track them in near real-time. Have questions? Learn more about what we do, check out our FAQs or contact us.