This is a test of Grzegorz Link’s “Enhanced” Global Growth Cycle (GGC) strategy. Like the original GGC, this enhanced version uses the OECD Composite Leading Indicator to determine risk exposure, but unlike the original, it also considers momentum to determine the specific risk on/off assets to hold.
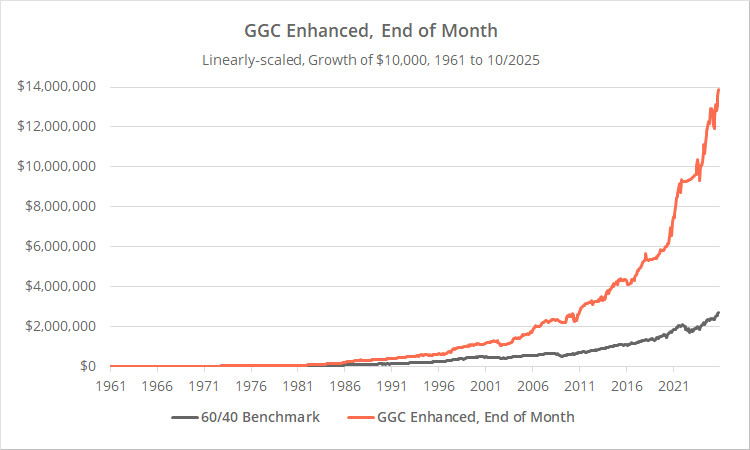
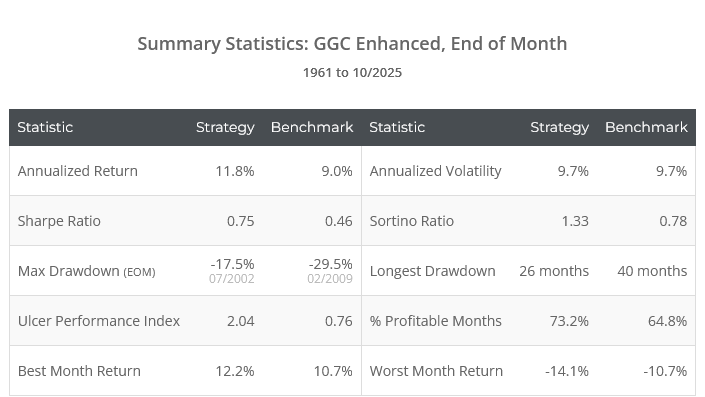
Backtested results from 1961 follow. Results are net of transaction costs – see backtest assumptions. Learn about what we do and follow 90+ asset allocation strategies like this one in near real-time.

Logarithmically-scaled. Click for linearly-scaled results.
Like our test of the original GGC, our results differ significantly from the author’s. We use earliest-vintage OECD CLI data to minimize lookahead bias. More on this later.
Strategy rules tested:
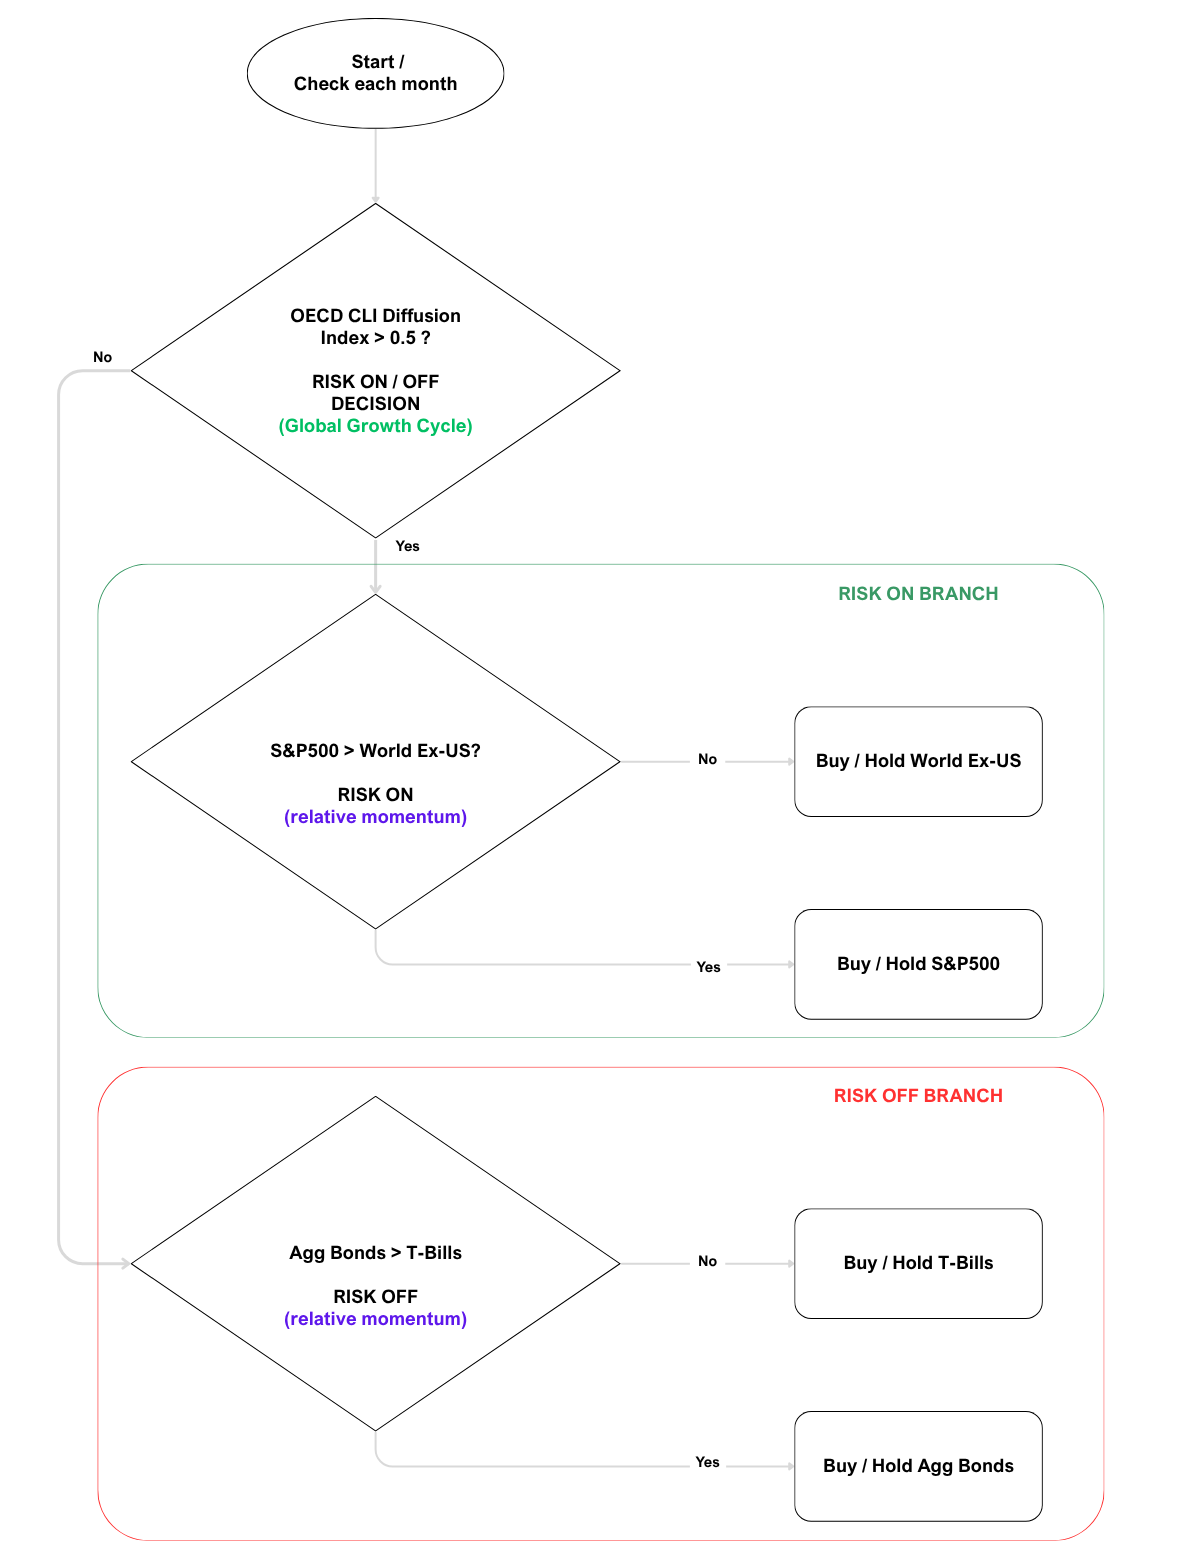 The author provided the helpful flow chart to the right laying out the strategy rules (click to zoom).
-
At the close on the last trading day of the month, calculate a “Diffusion Index” based on OECD CLI data from the previous month-end (the 1-month lag is due to the delay in reporting). The Diffusion Index measures the % of countries whose CLI value rose month-over-month.If the Diffusion Index value is > 50%, the strategy is risk on, otherwise it is risk off. The original GGC was based only on this first step (1). GGC Enhanced takes the additional steps below to determine the specific risk on/off asset to hold.
-
If risk on, measure the 12-month return of US versus international stocks (represented by SPY and IEFA). 12-month return is one of the most common measures of momentum.If the 12m return of SPY > IEFA, allocate 100% of the portfolio to SPY, otherwise IEFA.
-
If risk off, measure the 12-month return of US aggregate bonds (AGG) versus short-term US Treasuries (BIL).If the 12m return of AGG > BIL, allocate 100% of the portfolio to AGG, otherwise cash.
- All positions are executed at the market close. Hold all positions until the last trading day of the following month.
From end-of-month to mid-month:
OECD CLI data for a given month is released in the first 1-2 weeks of the following month (see future release dates). The original GGC strategy took advantage of this by executing trades on the 15th calendar day, rather than waiting until the next month-end.
We’ve opted to track a second version of GGC Enhanced that does the same. Members will note that there are two versions of GGC Enhanced in the members area: Monthly and Mid-Month.
Strategy results for this mid-month version versus other versions of GGC follow. The mid-month results begin in 1973 due to data limitations, so the results below only cover the overlapping period.

Logarithmically-scaled. Click for linearly-scaled results.
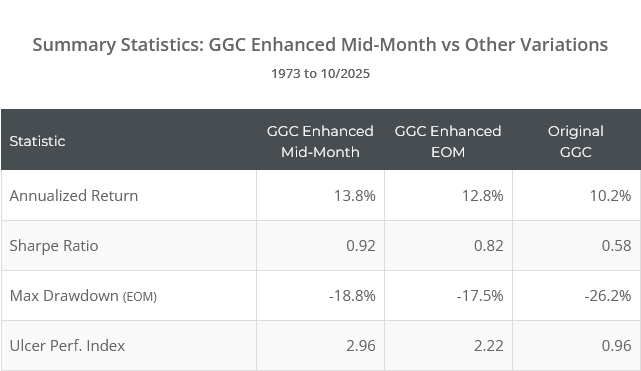
On paper, trading at mid-month has outperformed trading at end-of-month, but most of that outperformance came during a brief period in the 1980’s and the two versions have tracked each other closely since.
Geek note: For multiple reasons, this mid-month version is not the same as the monthly version traded on a mid-month alternate trading day. This is a geeky discussion that would only appeal to a small % of our audience. Interested readers should contact us. Suffice to say, if seeking a mid-month trade, this mid-month version is likely better than the monthly version traded on a mid-month alt. trading day.
The importance of vintaged economic data:
Many types of economic data are initially released at one value, and then later revised. That means that a backtest based on the data as it looks today may not accurately reflect positions that would have been taken in real-time. This is especially true for OECD CLI data, because the entire data series since inception is affected by the addition of each new monthly data point.
For all economic data on this platform, we use the earliest data point available (aka, the “earliest vintage”) (2). In our test of the original GGC, we showed the impact of using this earliest vintage data. It was significant.
We did not go through that same process for GGC Enhanced. Comparing the author’s results to our own, we see some negative impact but not significantly so. That should be considered a small feather in the cap for GGC Enhanced that it held up well on unseen data.
Our take on GGC Enhanced:
Despite the additional complexity, GGC Enhanced is driven by the same economic data as the original, and our take on both strategies are similar.
Because GGC trades on such a unique data set, it has delivered returns with relatively low correlation to other strategies we track. All things being equal, that’s a good thing. When we combine dissimilar strategies (into what we call Model Portfolios) we smooth overall portfolio performance, because this strategy will often zig when that strategy zags.
If we were to select just a single strategy or a very small number of strategies, we would prefer the Enhanced version, because it takes into account long-term momentum, a fundamental market force that has worked for basically as long as financial markets have existed (see “Core Idea #1”).
However, if we were building a diversified portfolio of strategies, we might prefer the original version. Many of the strategies we track already have exposure to momentum. If the purpose of GGC is to smooth out performance, it may be more useful to have a “purer” signal with lower correlation to other strategies in the portfolio.
Members will note that this bears out in the Portfolio Optimizer. Despite inferior performance on paper, the original GGC still appears in more optimized portfolios.
A big thank you to Grzegorz Link for the opportunity to put his strategy to the test. Grzegorz is one of the good guys. He is a source of novel ideas, but is always self-deprecatory about the limits of backtesting and the risks of overfitting. We highly recommend you follow the good things he’s doing.
New here?
We invite you to become a member for about a $1 a day, or take our platform for a test drive with a free membership. Put the industry’s best Tactical Asset Allocation strategies to the test, combine them into your own custom portfolio, and follow them in real-time. Learn more about what we do.

* * *
Calculation notes:
- The original GGC signaled risk on when the Diffusion Index was greater than or equal to (>=) 0.5. This enhanced version uses greater than (>). That difference was not intentional by the author, but we’ve followed suit in our results to stay consistent with his. This only affects historical results as there are currently an odd number of countries in the index, but that could change in the future.
- Not only is each country’s entire data series revised when each monthly data point added, but the list of countries included in the CLI has periodically changed over time. We vintage the monthly data points for each country, but we cannot properly vintage the way in which the constituents countries have changed prior to 12/2021. Long story short: our vintaging for OECD CLI data removes some of the lookahead bias, but it is imperfect, and a degree to uncertainty still exists.