We track 100+ published Tactical Asset Allocation (TAA) strategies, so these results are broadly representative of TAA as an investment style.
TAA did reasonably well in 2025 and has done very well in these early days of 2026, relative to the ubiquitous 60/40 benchmark. How much of that is due to TAA correctly timing the market and how much is simply due to the types of assets TAA generally holds?
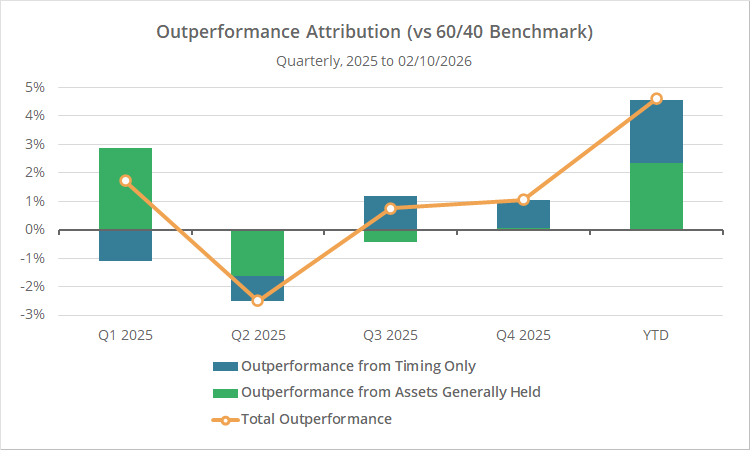
In the chart above we break down quarterly those two sources of outperformance: timing (blue) and assets TAA generally holds (green). The sum of the blue and green bars is total outperformance (gold). We’ll discuss methodology in a bit.
To reiterate, we’re measuring outperformance relative to the benchmark, not simply total return. So if total outperformance reads +1%, that means that TAA returned 1% more that quarter than the 60/40 benchmark, NOT that TAA returned 1%.
A quarterly breakdown:
- Q1 2025: “Generally held assets” outperformed (because they include less exposure to US stocks, which were weak). Timing was poor as TAA was too aggressively positioned entering into the market pullback in March. Net-net, still an outperforming quarter.
- Q2 2025: Both generally held assets and timing performed poorly. Stocks were the best place to be in Q2, and TAA was too conservatively positioned entering into the recovery. TAA often underperforms during short-lived blips like March/April (aka “whipsaw”).
- Q3 and Q4 2025: Generally held assets performed in line with the benchmark both quarters, but timing was good (overweighting gold and intl. assets was a big part of that), resulting in outperformance over the benchmark.
- YTD 2026: Both generally held assets and timing (overweighting everything but US stocks and bonds) have done well, resulting in strong outperformance so far in 2026.
In total, 57% of outperformance has been from generally held assets, and 43% from timing.
“Generally held assets” outperformance is fine, but timing outperformance is a must:
TAA strategies tend to more diversified than the 60/40 benchmark, with significant exposure to international asset classes and alternatives like gold and commodities. That has actually been a drag on performance over the last 15+ years due to the strong outperformance of the US market.
TAA should get “credit” for any outperformance that results from this diversification, but it’s important that it also produce outperformance from timing. If it doesn’t, we should just buy and hold these assets and save the headache, trading frictions and tax liability (when applicable).
Methodology:
Easy peasy…
Start with the average asset allocation of all TAA strategies over their entire history. Backtest this as a buy & hold strategy, rebalanced monthly. This is the performance of “assets generally held”.
Outperformance from assets generally held =
% return of assets generally held – % return of 60/40 benchmark
Outperformance from timing only =
% return of the average strategy we track – % return of assets generally held
Total outperformance =
% return of the average strategy we track – % return of 60/40 benchmark
Note: This data only includes individual strategies. We’ve ignored Meta Strategies.
Outro:
This was just a thought experiment. Is it actionable? Not really, but it’s interesting to suss out the true source of out/underperformance to know when TAA is timing the market well, and when it’s just benefiting from the tailwinds of diversification.
This may become a regular feature in the future.
New here?
We invite you to become a member for about a $1 a day, or take our platform for a test drive with a free membership. Put the industry’s best tactical asset allocation strategies to the test, combine them into your own custom portfolio, and follow them in real-time. Learn more about what we do.
