We track 50+ public Tactical Asset Allocation (TAA) strategies in near real-time, allowing us to draw broad conclusions about TAA as a trading style.
By design, most of those strategies trade just once per month, and most assume that next month’s asset allocation is both calculated and executed on the same day (learn more). When that day arrives each month, it can be quite stressful. The investor must wait for the strategy to converge on the day’s final allocation, and then quickly execute that allocation at the closing price.
We’ve often said however that, over the long-term, perfectly executing the strategy at the same day’s close is unnecessary. TAA strategies are designed to capture broad market trends and have been robust to reasonable delays in execution.
We’ve never quantified that site-wide though, so in this post we’re going to look at adding a full 1-day lag to all monthly strategies. In other words, we’ll assume that an investor used the signal generated each month, but then waited a full day and executed that signal at the following day’s close.
Test Results: 1990 to 04/2020
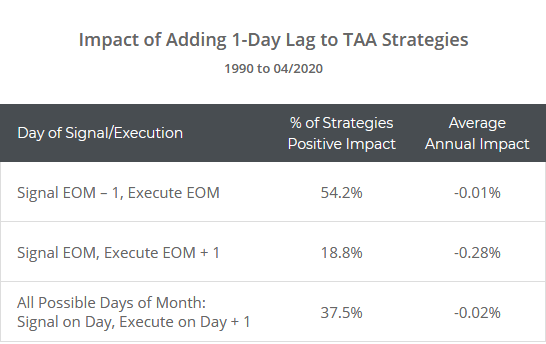
Here we’ve quantified the impact in terms of both the % of strategies that would have generated higher returns with a 1-day lag, and the average annual impact on returns.
Most of our members trade these strategies at month-end, so we’ve put extra focus on the days surrounding end-of-month (EOM).
The three ways we’ve sliced this data:
- Row 1: Use the signal from the day prior to end-of-month (EOM – 1) and then execute that signal at the end-of-month close (EOM). Members: To get your EOM – 1 signal, set all strategies to day 20 in your model portfolio.
- Row 2: Use the signal from end-of-month (EOM) and then execute that signal at the close on the following trading day (EOM + 1). Members: To get your EOM signal, set all strategies to day 21 in your model portfolio.
- Row 3: A unique feature of our platform is that we allow for month-end strategies to instead trade on any other day of the month. So, for all possible days of the month, use today’s signal and then execute that signal at tomorrow’s close.
What these results tell us (we’ll unpack each of these throughout this post):
- Adding a 1-day lag has not significantly impacted performance (to the average strategy, executed on the average day) over the long-term. The annual impact on returns has been just -0.02% (2 bps). That’s noise and essentially zero. Of course, in any particular month it could have an enormous impact, but those differences have tended to wash over time.
- There has been a right way and a wrong way to trade the end-of-month. Signaling at EOM – 1 and executing at EOM has had little impact on results, but signaling at EOM and executing at EOM + 1 has performed poorly.
Broadly speaking, adding a 1-day lag has had little effect on long-term results. That should ease some of the burden for investors not keen on the stress of becoming traders for a brief window each month. As always, there are devils in the details though, so consider reading this post in its entirety to better understand the issue.
How the impact of a 1-day lag has evolved over time:
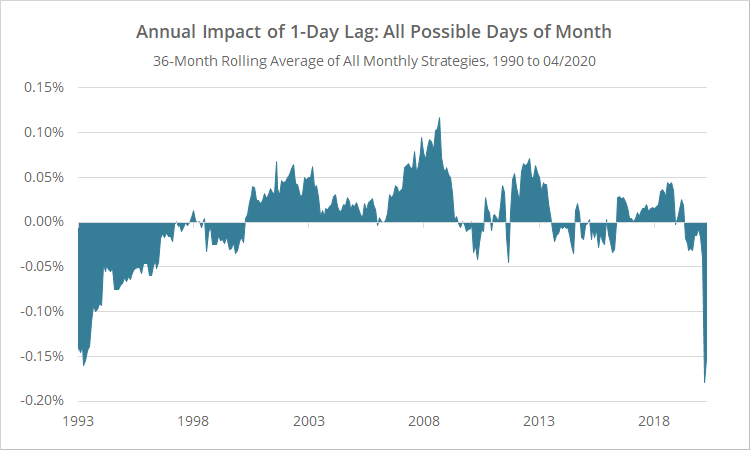
The impact of the 1-day lag has evolved over time. To illustrate, below we’ve shown the 3-year rolling average impact on annual returns across all strategies and all possible days of the month.

More data: results for two variations of EOM trading: Variation 1 | Variation 2
Prior to (roughly) 2000, adding a lag would have had a negative impact on performance. From 2000 to the 2008 Global Financial Crisis it would have had a positive impact. And from 2008 and beyond it would not have been consistently positive or negative, until our current crisis.
Why? We speculate that evolution was a result of a similar evolution in short-term mean-reversion in many risk assets. For the trading veterans among us, think RSI(2). We could write a whole series on this subject, but we don’t want to bog down this post. We’ll just leave it at this: The evolution in these results over the last 30+ years makes sense with what we know about the market. It isn’t random.
In our current crisis (far right of chart), adding a 1-day lag would have been a bad idea. That’s due to the historic speed at which the market fell initially. Any delay in paring down risk exposure would have hurt performance. That’s probably a one-off and not indicative of the future impact of a 1-day lag in “normal” times, but time will tell.
Be prepared to be wrong in the short-term:
The stats presented above are the view from 30,000 feet up.
In any particular month however, adding a 1-day lag could have a major impact. It could result in an allocation that turns out to be less effective and/or executed at a worse price than had you followed the conventional same-day signal and execution at the close.
That drift from the results shown on our site can be psychologically difficult when you find yourself underperforming for a few months in a row (much less so when you find yourself outperforming), but it’s an inevitable result of the randomness of markets in the short-term.
The point is if you’re going to add this 1-day lag in execution, you need to embrace the long-term results, and be prepared for occasional short-term disappointment.
Not all strategies are affected equally:
Adding a 1-day lag will have a bigger impact on more active strategies where the signal between today and tomorrow is often sharply different (think Vigilant Asset Allocation vs Max Diversification).
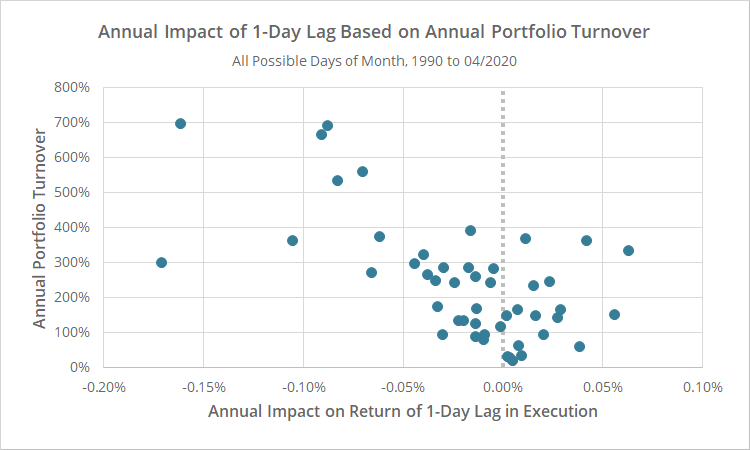
The “portfolio turnover” stat included on all backtests is a good gauge of how active a strategy is and how much it could be affected by the lag. The graph below illustrates this relationship. On the y-axis, we’ve shown each strategy’s annual portfolio turnover, and on the x-axis the annual impact on return.

More data: results for two variations of EOM trading: Variation 1 | Variation 2
For those strategies with less than 200% annual turnover, more than half saw a small benefit from adding the 1-day lag. For those strategies with greater than 200% turnover, 80% saw a decrease in returns.
Importantly however, by combining multiple strategies into a single portfolio (a central feature of our platform) we inherently reduce much of that day-to-day variability between strategies.
So, if you’re trading just a couple of very active strategies, be extra cautious adding the 1-day lag. But if you’re combining many strategies together (which everyone should be doing anyways), there’s less concern.
Why strategy authors usually assume execution at the month-end close:
TAA strategy authors usually assume strategies are executed at the close on the last trading of the month, as does most of our analysis on this site. Why is that, when there appears to be so little long-term impact from adding a 1-day lag in execution? It’s all about the length of the backtest.
For many asset classes, more data exists in a monthly timeframe than daily. For example, the real estate ETF VNQ began trading in 2004. The underlying index that VNQ tracks, the MSCI US REIT Index (Bloomberg: RMS/RMZ), is available as daily data from 1995. But the FTSE NAREIT Index (Bloomberg: FNER/FNERTR), a very close proxy, is available as monthly data from 1972.
By assuming that a strategy both calculates and executes the signal at the close on the last trading day of the month, authors can use that monthly data to generate much longer backtests. And all things being equal, more data is a good thing.
The disparity between the two flavors of end-of-month results:
Recall from our initial stats, that the two variations of end-of-month (EOM) results were very different. Using the signal from the day prior to end-of-month (EOM – 1) and then executing at the EOM close, had little impact on results. But if you had instead used the signal from EOM and then executed the following day (EOM + 1), annualized return would have fallen by about -0.28%.
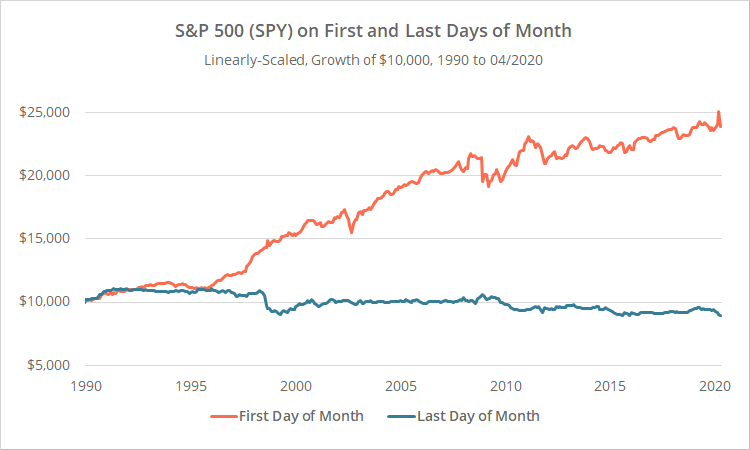
Why? We assume it has something to do with the fact that risk assets have tended to perform very differently on the first and last days of the month. To illustrate, the graph below shows the result of trading the S&P 500 (SPY) on the first day of the month (orange) versus the last (blue) from 1990.
Note the obvious disparity. How precisely this relates to what we’re seeing with the 1-day lag would require further study. Our point is that there are fundamental differences between the first and last days of the month, so it’s unsurprising that we’re seeing very different results between the two versions of the end-of-month trade as well.

Linearly-scaled. Click for logarithmically-scaled results.
Trading at times other than the close:
These results demonstrate that these strategies have been robust to reasonable delays in execution.
That implicitly says that there’s no reason investors have to limit themselves to just executing at the close. If there’s an opportunity to use your judgement to execute trades intraday at better prices, then investors should consider that.
Being laser focused on the closing price is good if you’re concerned with staying perfectly in-line with the results we show on this site, but it’s not necessarily required.
Our official take on adding a 1-day lag:
Despite the results shown here, we still believe that in a perfect world the optimal approach to executing the strategies we track is as they were originally designed, with same-day signal/execution.
Regardless of what the long-term stats show, trading these strategies as they were designed (a) removes any psychological pain of being wrong in the short-term, and (b) removes any concern about the impact of the lag evolving over time and becoming negative (as it was prior to 2000).
Having said that, not everyone has the desire or ability to both interpret and execute changes to their portfolio quickly at the same-day close. Many long-term investors may not be happy being forced to become traders for a brief period every month.
For those folks, we’ve shown that lagging execution by a day probably isn’t that big of a deal in the long-term. If it means that an investor stays in the game, rather than getting frustrated and taking their ball and going home, then it’s worth adding the 1-day lag. That provides a full day for investors to consider their new position and plan for how to execute it optimally.
New here?
We invite you to become a member for about a $1 a day, or take our platform for a test drive with a free limited membership. Put the industry’s best tactical asset allocation strategies to the test, combine them into your own custom portfolio, and follow them in near real-time. Not a DIY investor? There’s also a managed solution. Learn more about what we do.
Geek notes:
(1) These results are a little different than what we saw in our previous deep dive into using the Agg. Alloc. Report to time the market. There we saw a small benefit from adding a 1-day lag. Here we see essentially no impact. The reason for that is likely because the tests cover different periods. The Agg. Alloc. test covered 2000 to present, while this test covered 1990 to present. And as previously shown, the decade from 1990 to 2000 was less favorable to adding a lag.
(2) What about the only true daily strategy we track, Stoken’s ACA? This analysis only included monthly strategies. For the daily version of Stoken’s ACA, adding a 1-day lag to execution would have reduced annual return by -0.14%.

