Many of the tactical asset allocation strategies that we track are designed to only trade at the end of the month. When tracking these strategies for members however, we show the results of trading on other days of the month as well. We don’t do this to show off our backtesting prowess; it’s an important analytical tool for understanding more about a strategy and for sniffing out potential curve-fitting.
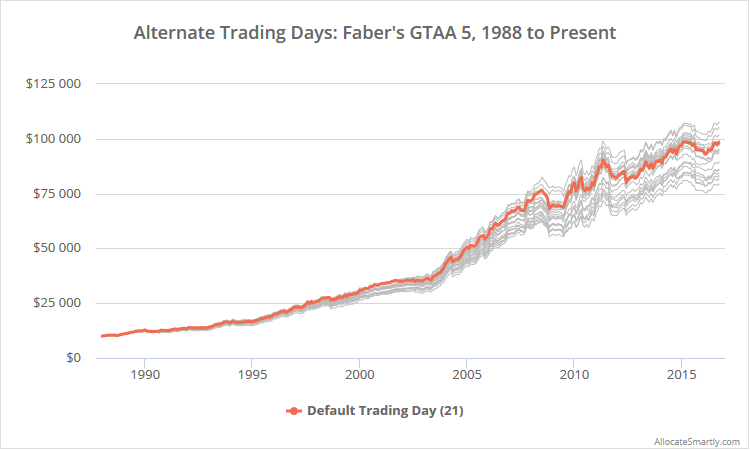
An example from our members section is shown below. This chart shows the results of trading Meb Faber’s classic GTAA 5 at the end of the month as designed (orange) versus all other days (grey) from 1988. Read more about our backtests.

Linearly-scaled to emphasize differences. Click for logarithmically-scaled chart.
Tactical asset allocation strategies tend to trade monthly for two reasons: (1) monthly trading matches the longer-term nature of TAA (i.e. it helps to ignore day to day noise) and (2) monthly asset data can often be simulated much further into the past than daily data, allowing for longer backtests.
How we test trading on other days of the month:
Backtesting results for other days of the month isn’t as simple as it might first appear.
The strategy shown above trades based on a 10-month moving average. If we’re trading mid-month rather than at the end of the month, we need to calculate that 10-month moving average based on the most recent 10 mid-month values, in order to stay consistent with the author’s original intent. But every month has a different number of trading days, so this isn’t as simple as using the nth chronological trading day or the nth calendar day of each month.
To solve this problem, we first normalize every month to precisely 21 trading days (the average number of trading days in a month). Shorter months are stretched, and longer months compressed as shown here. The first trading day will always be day 1 and the last trading day will always be day 21. In that way, when calculating the 10-month moving average for day-n, we can simply use the last 10 day-n prices.
What alternate trading days can tell us:
There are sometimes significant differences in results trading on different days of the month. Some of that difference is inevitable and can simply be explained by random chance.
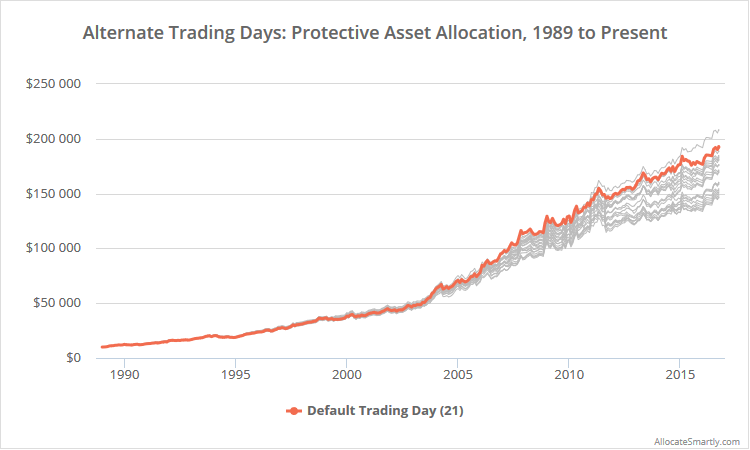
In a simple world, we’d expect to see a fairly tight spread between trading days, with end-of-month (i.e. day 21) results falling somewhere in the middle, as with GTAA 5 above. But generally-speaking, that’s not the case. Most monthly trading strategies perform better trading at the end of the month than other days. Take for example, Keller and Keuning’s Protective Asset Allocation. The graph below is taken from our members section, and shows the results of trading at the end of the month as designed (orange) versus all other days (grey):

Linearly-scaled to emphasize differences. Click for logarithmically-scaled chart.
There are two competing reasons why these strategies tend to perform better trading at the end of the month. The first is positive and something that I think Keller’s strategy is exploiting: true end-of-month effects. The second is negative and to be avoided: overfitting to the data.
True end-of-month effects:
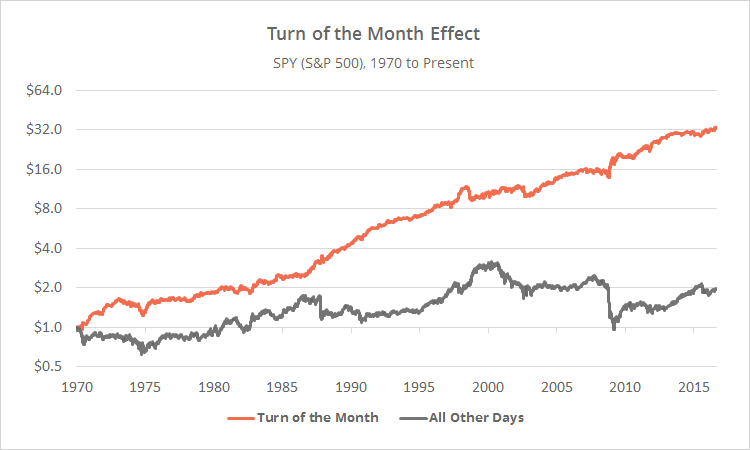
There are tangible end-of-month effects in most asset classes. To illustrate, below I’ve shown the results of holding the S&P 500 (represented by SPY) for just seven days around the turn of the month in orange, versus all other days of the month in grey, since 1970. This is only meant as a proof of concept, so I’ve ignored transaction costs and return on cash.
The takeaway from the graph above is that there are significant differences in asset performance at the turn of the month, and a monthly trading strategy that performs better when trading at the end of the month may simply be exploiting a real market anomaly. In other words, the outperformance may be a feature, not a bug.
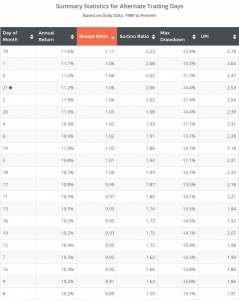
To determine if that were the case, I would expect to see a cluster of outperformance around the turn of the month. In the table to the right, taken from the same test of Keller and Keuning’s Protective Asset Allocation, I’ve sorted alternate trading day results by Sharpe Ratio (click to zoom).
Note the cluster of outperformance in DOMs 19, 20, 21, 1 and 2 (i.e. the turn of the month) across multiple metrics: Sharpe Ratio, Sortino Ratio, and UPI. The fact that DOM 21 is in a cluster of outperformance gives me a degree of confidence that the strategy is exploiting actual turn of the month effects.
Overfitting to the data:
The flip side of this analysis are those instances where end of month outperformance is an island. If we see strong performance trading at the end of the month, but very poor performance on nearby days, that’s a strong indicator that a monthly trading strategy is overfit.
Consider a strategy that trades based on a 12-month moving average. If we test the same strategy using a 11-month or 13-month moving average and performance suffers significantly, it almost certainly means that the strategy is overfit to that specific set of data. Small changes in backtest parameters should not have a significant impact on results. The same holds true when trading monthly trading strategies on nearby days of the month.
The presence of symptoms of overfitting doesn’t mean that a strategy has no value, or that it doesn’t contain some predictive elements, only that the backtested results as they are usually shown trading at the end of month are likely too optimistic and unlikely to perform as expected out-of-sample.
Alternate Trading Days: An Analytical Tool
There are many tools in our toolbox to judge the efficacy of strategies. Some are widespread but easily fooled, like the Sharpe Ratio. Others are less easily accessible, but potentially more powerful, like the one we’ve shown here. Testing alternate trading days can help us to better understand whether a strategy is exploiting monthly seasonality effects and help to suss out potential overfitting.
We take this approach one step further by allowing members to not just view performance on alternate trading days as we’ve done here, but to actually combine multiple strategies, all with their own unique trading day, into a custom model portfolio which they can then backtest and track in near real-time.
We invite you to check out the awesome suite of data and tools that we’ve created by becoming a member for less than $1 a day. Paid memberships include access to all of the tactical asset allocation strategies in our database, and your own custom model portfolio, all with a risk-free money back guarantee.

