We track 80+ Tactical Asset Allocation (TAA) strategies, most of which were designed from the perspective of a US investor trading US ETFs. Most European investors can’t access US ETFs, instead trading UCITS funds listed on non-US exchanges, often denominated in currencies other than USD.
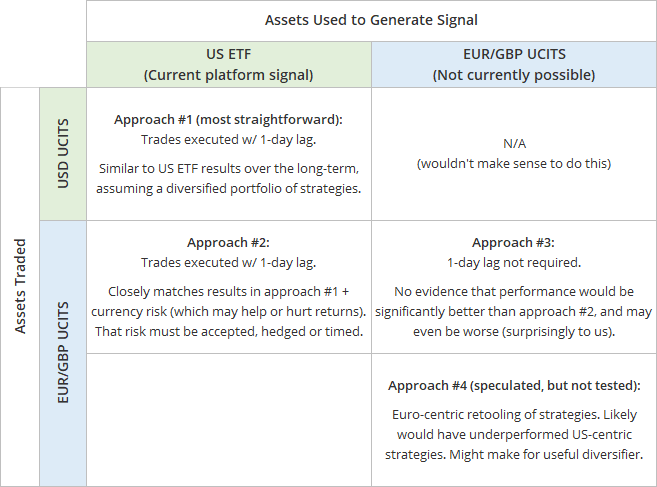
In this post we’ll provide data analyzing four approaches a European investor might take in trading US TAA strategies with UCITS funds. Below is a summary of those four approaches. Each differs based on the assets used to generate the trading “signal” (i.e. the strategy’s asset allocation at any given moment), and the assets actually traded.
Full disclosure: We are US investors, and all our years of experience are from that perspective. We’ve done our best to provide an accurate, informed analysis here, including consulting with Dr. Wouter Keller to review our work. Inevitably however, there could be blind spots in this analysis that we are not sensitive to, such as tax consequences and investment fees.
Approach #1 (the most straightforward): USD-denominated UCITS funds traded at the next Europe close
In terms of matching the results we show on our platform, the most straightforward approach is trading USD-denominated UCITS funds, traded the following day due to the time difference. For simplicity’s sake, we’ll assume trades were executed at the next market close in Europe.
Before we show hard data, let’s talk about two points we’ve demonstrated in the past:
- When trading a diversified portfolio of TAA strategies, delaying the execution of trades in the US by a full day (i.e. executing today’s signal at tomorrow’s close) would not have significantly impacted historical results over the long-term. TAA is designed to capture broad market trends and has been robust to reasonable delays in execution. Read more.
- Getting the broad “category” of asset class right is much more important than the specific asset. For example, knowing when to move from some defensive asset to equities is much more impactful than the specific flavor of equities (large cap growth, small cap value, etc.) We can achieve most of TAA’s performance just by getting the category right. Read more.
Defining our test:
We start with the Aggregate monthly asset allocation across all strategies we track (to represent a diversified portfolio of TAA strategies) between 2017 and 2023. To keep this analysis manageable, we use the category of asset class as described in the link above, not the specific asset.
We assume two hypothetical portfolios, each trading just once per month:
- Portfolio #1: Trade the aggregate monthly allocation shown on our platform at the close on the last US trading day of the month using US ETFs.
- Portfolio #2: Trade the aggregate monthly allocation shown on our platform at the close on the first Europe trading day of the following month using UCITS funds, denominated in USD.
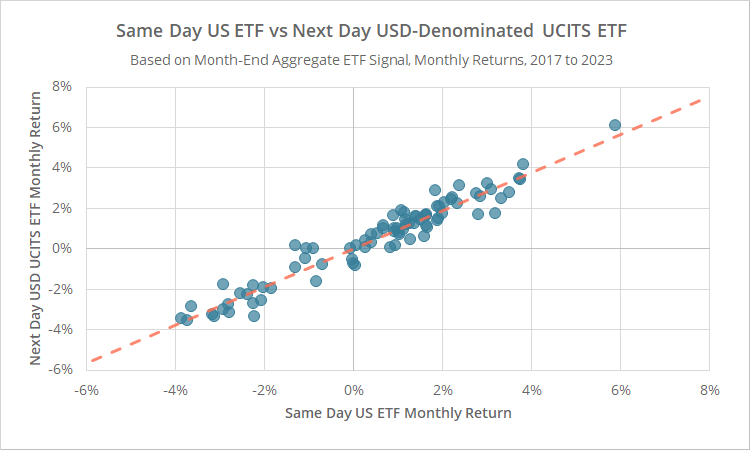
In the scatterplot below, we show the monthly returns of our same day US ETF portfolio (x-axis) versus our next day USD-denominated UCITS portfolios (y-axis).
Calculation notes: See the end notes for a list of ETFs and UCITS funds used to represent each category of asset class. Unlike most of the analysis on this site, we’ve ignored transaction costs and return on cash.
Note the close fit between our two hypothetical portfolios. While the average absolute difference between them was +/-0.4% per month (almost entirely due to the 1-day lag), over the long-term, those differences mostly washed out.
On average, our UCITS fund portfolio underperformed by just -0.02% per month (-0.24% per year) over the entire test. That is essentially noise, and there’s no reason to think that difference wouldn’t completely wash out over the longer-term.
None of this should be surprising. We’ve looked at an even longer delay in execution (next market close in the US) and found little impact over a much longer period of time. Read more.
Two additional notes:
- We’re not suggesting that European investors limit themselves to asset class “categories”. We only did that to make this analysis manageable. In actuality, UCITS funds are available covering nearly all of the more narrow asset classes we cover.
- The investor would still face currency risk at some point in the future when they opt to move their USD denominated funds back to their home currency, but we view that as a “wealth management” issue beyond the scope of what we do.
To summarize: in terms of matching the results we show on our platform, the most straightforward approach is trading USD-denominated UCITS funds, executed the following trading day in Europe.
Geek note: Our analysis of approach #1 above (and approach #2 below) only extends back to 2017. That’s extremely short by our standards. Unfortunately, we required actual UCITS fund data to perform these analyses properly, and for multiple asset classes considered, that data doesn’t extend very far back.
Approach #2: EUR/GBP-denominated UCITS funds traded at the next Europe close
In this analysis we’ll use the same Aggregate monthly asset allocation across all strategies we track (again, divided by category as described above).
We’ll assume two hypothetical portfolios, each trading just once per month:
- Portfolio #1: Trade the aggregate monthly allocation shown on our platform at the close on the first Europe trading day of the following month using USD-denominated UCITS funds. This is our straightforward solution from approach #1.
- Portfolio #2: Trade the same % allocation at the same Europe close, but instead trade EUR-denominated UCITS funds.
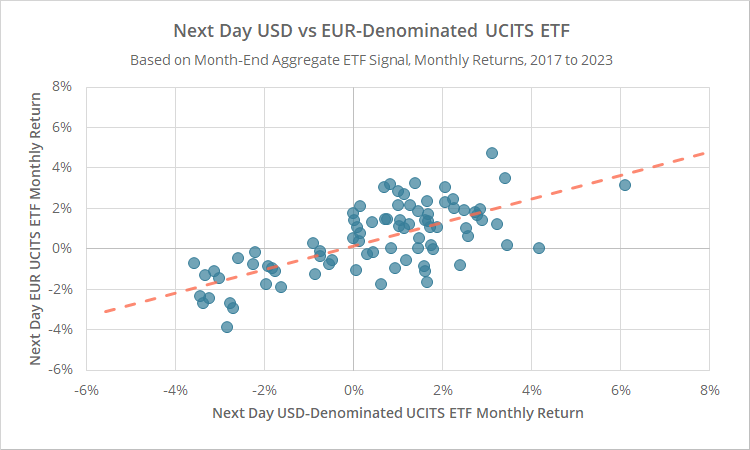
Both portfolios are executing the same % allocations at the same time, so any difference between them is almost entirely due to currency risk. In the scatterplot below, USD-denominated UCITS returns are on the x-axis and EUR UCITS returns are on the y-axis.
Calculation notes: See the end notes for a list of ETFs and UCITS funds used to represent each category of asset class. Unlike most of the analysis on this site, we’ve ignored transaction costs and return on cash.
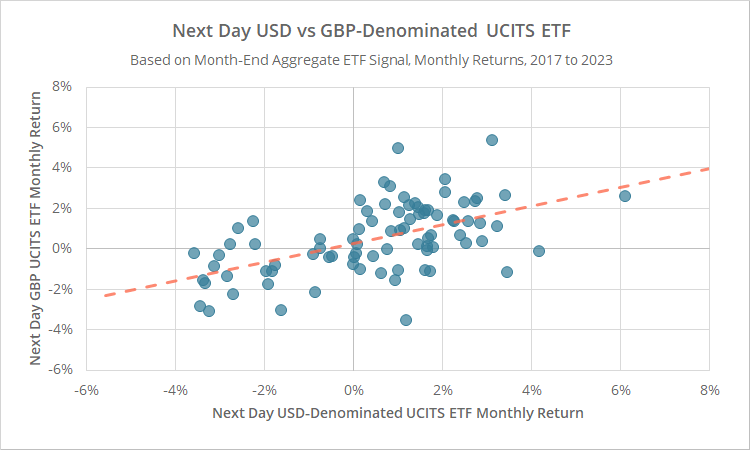
Cleary, these portfolios track each other much less closely than in our previous test. Here’s the same analysis trading USD vs GBP-denominated UCITS funds.
The average absolute difference between our USD and local currency portfolios was +/-1.3% (EUR) and +/-1.6% (GBP) per month. On average, our EUR/GBP-denominated portfolios underperformed by an average of -0.10% (EUR) and -0.06% (GBP) per month (-1.17% and -0.70% per year).
To reiterate, that’s almost entirely due to currency differences. But here’s a key takeaway: this underperformance isn’t inherent and could just as easily be out-performance in the subsequent period. That is currency risk and is unrelated to the underlying performance of the strategies.
What do investors do with this risk? They can either accept it as the price of trading US-centric strategies, hedge it – which bears some inherent costs, or attempt to time it to their advantage.
Geek note: Notice the flattening of the regression in the graphs above (orange dotted line). When the USD UCITS portfolio was positive for the month, it outperformed the EUR UCITS portfolio 55% of the time with an average difference of +0.4%/month. When the USD UCITS portfolio was negative, it outperformed just 25% of the time, with an average difference of -0.8%/month. We’re not sure what to make of how stark this difference was. Perhaps just an artifact of the relatively small sample size?
Approach #3: Signaling based on EUR/GBP priced assets
To be clear, we don’t currently provide a way to do what we’re going to describe next. This is purely a “what if” discussion.
We currently generate strategy “signals” (i.e. the strategy’s asset allocation at any given moment) based on US ETFs. What if we instead generated that signal based on EUR/GBP denominated UCITS funds, and then used that signal to trade those UCITS funds? Is there some informational advantage in calculating the strategy signal in the actual currency it will trade?
In our analysis below, we don’t use actual UCITS data. We’re able to extend this test much further into the past by using our existing platform and our existing US ETF data, simply adjusted for exchange rates at that moment in time. That isn’t strictly the same thing, but it’s a very good approximation over the long-term of how such an approach would perform.
See the “geek note” at the end of this section to understand why we didn’t use this method in our analyses of approaches #1 and #2.
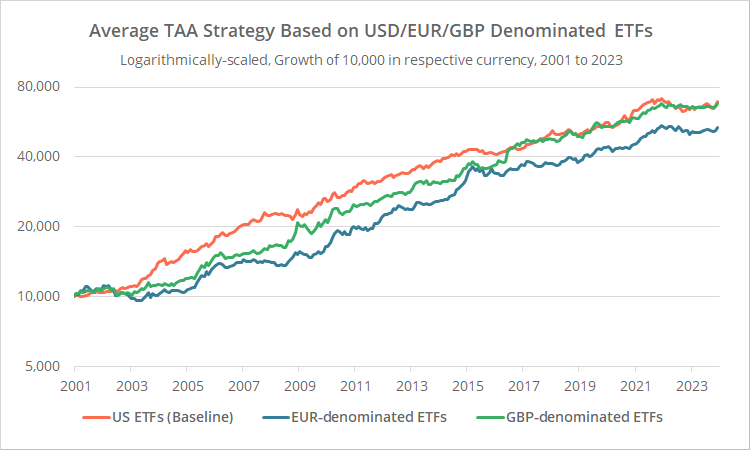
In the graph below we show three equity curves modelling the performance of the average TAA strategy we track when signaling based on US ETF data (orange, our normal platform results), EUR-denominated ETFs (blue) and GBP-denominated ETFs (green), and then executing trades on those same currency-adjusted ETFs, since 2001.
These results include the same transaction cost and cash assumptions as our standard backtests.
The USD portfolio slightly outperformed the GBP portfolio, and strongly outperformed the EUR portfolio. That outperformance is almost entirely related to currency fluctuations, and unrelated to underlying strategy performance.
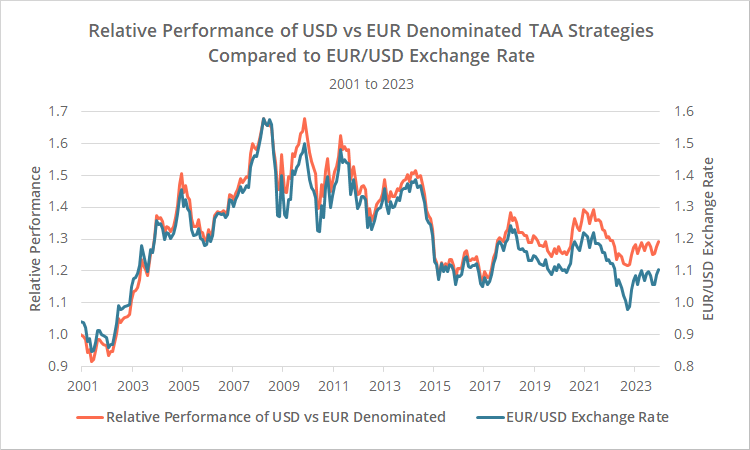
To demonstrate, below we show two data series for the EUR portfolio. The orange line represents the relative performance of the USD vs EUR portfolios. When the line is increasing, the USD portfolio is outperforming, and vice-versa. The blue line is the concurrent EUR/USD exchange rate.
Note how well the two lines track each other. Clearly, the primary driver of out/under-performance has been changes in the exchange rate.
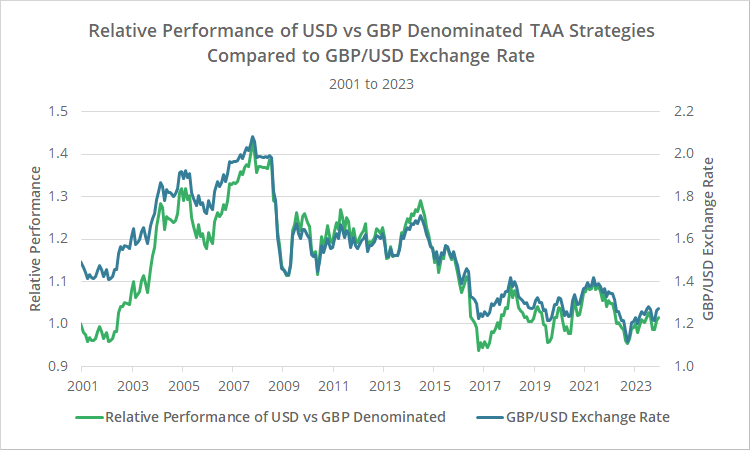
Here is the same data for the GBP portfolio. Same story.
These results were surprising to us. We thought there would be some advantage to trading EUR/GBP assets when signaling based on that same currency.
But these results make sense if changes in the exchange rate hold no informational advantage. If the trend (or momentum or whatever the strategy is using to trade) is the key driver of performance, and changes in the exchange rate are independent of that and do not affect the trend in any actual, meaningful way, you would expect the results to look like they do here.
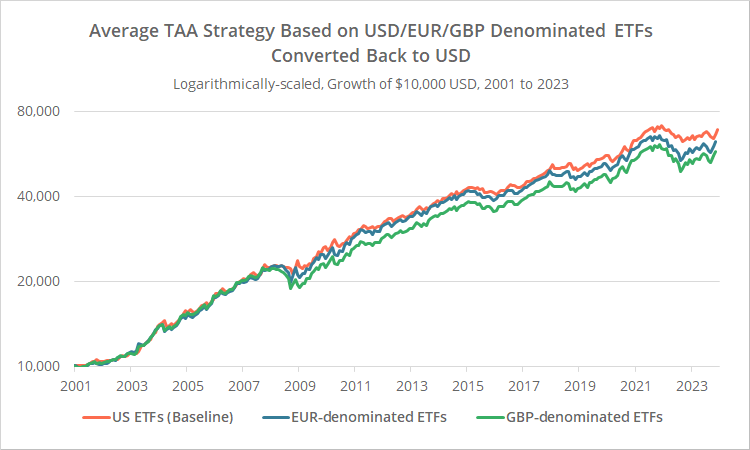
In fact, you would expect performance to possibly be worse because we’re “tainting” the signal with unnecessary noise. That bears out in the data. If we convert these EUR/GBP signaled portfolios back to USD, they slightly underperform the “pure” USD signal over time.
This ability to both signal and trade the strategies we track based on EUR/GBP-denominated data is sometimes viewed as a panacea by European investors. As we’ve demonstrated here, it is not.
Currency risk is its own unique beast, unrelated to core strategy performance, and the signal we provide based on US ETFs has been just as effective as one generated based on EUR/GBP-denominated assets, and possibly even more so.
Geek note: In this analysis of approach #3 we used currency-adjusted US ETF data, rather than actual UCITS data, allowing us to extend this test much further into the past. Why didn’t we use this method previously? The purpose of approach #1 was specifically to show that trading US ETFs and UCITS funds with a 1-day lag has performed similarly, and that required precise actual data. Approach #2 required us to generate a signal based on one thing (US ETFS), but execute trades on another (EUR/GBP UCITS) and our platform doesn’t support that (without a lot of programming headache).
Approach #4: Redesigning strategies to be Euro-centric
The last approach is one that we can’t test as part of this analysis, because it would take many months of effort to do justice. We do want to at least mention it though.
Up to this point, we’ve used the existing strategies we track and modified (a) the assets used in signaling allocations, and/or (b) the assets traded.
What if we reworked the strategies entirely so that they were Europe-centered instead of US-centered? For example, if a strategy used the US small cap value asset class in its calculations, what if we instead replaced that with European small cap value (and so on with other US asset classes).
This is more than just modifying currency denominations. This is completely modifying what the strategy is measuring.
Our intuitive expectation is that Europe-centered strategies would have generally underperformed their US-centered counterparts, simply based on the US’s broad outperformance for many decades. That might not always be the case, however. At the very least, it could serve as a useful diversifier.
We are not planning on taking on this project at this time. We don’t think that there’s enough demand to justify the enormous man hours required to set up and maintain such a parallel platform. Having said that, we prioritize new features based on member feedback, so if we hear enough positive feedback for the idea, we may add it to the development path.
In summary:
We covered four approaches a European investor might take in trading US-centric TAA strategies with UCITS funds. To recap:
-
Trading USD-denominated UCITS funds at the next Europe close, based on our existing platform signal.Closely matches the results we show on our platform over the long term, assuming a diversified portfolio of strategies.
-
Trading EUR/GBP-denominated UCITS funds at the next Europe close, based on our existing platform signal.Introduces currency risk, which may help or hurt returns. This risk must be accepted, hedged, or timed to the investor’s advantage.
-
Signaling based on EUR/GBP-denominated UCITS funds, and then trading those same EUR/GBP-denominated UCITS funds.We expected to see some advantage to this approach, but the results didn’t bear this out. In the end, it was not significantly better than approach #2, and may actually be worse.
-
Redesigning strategies to be Euro-centric.This is beyond the scope of what investors can do today on our platform. Our expectation is that historical performance would be inferior due to the US’s multi-decade outperformance, but that might not always be the case. At the very least, it could make for a useful diversifier.
New here?
We invite you to become a member for about a $1 a day, or take our platform for a test drive with a free membership. Put the industry’s best Tactical Asset Allocation strategies to the test, combine them into your own custom portfolio, and follow them in real-time. Learn more about what we do.
* * *
Update (02/14/2024): We’ve added a list of UCITS fund alternatives for all of the ETFs we cover on our platform to our members area. Our focus is identifying the largest, most liquid funds that provide substantially similar USD exposure to that asset class. Check it out.
Below are the assets used in our analyses of approaches #1 and #2 to represent each asset class category. The 4 assets listed for each category are the US ETF, and the USD, EUR and GBP denominated UCITS funds.
- US stocks: SPY, CSPX (LSE), CSPX (Euronext) and CSP1 (LSE)
- US real estate: VNQ, XRES (LSE), SXRA (Gettex) and XREP (LSE). Note: All funds are focused on the US real estate sector, except SXRA (which is 61% allocated to the US).
- International stocks: EFA, XMED (LSE), XMEU (Xetra) and XMEU (LSE). Note: The UCITS funds track European equities, while EFA tracks “developed intl.” equities (65% of which is European stocks).
- US Treasuries: IEF, CBU0 (LSE), CBU7 (Euronext) and CU71 (LSE). Note: IEF and CBU0 track 7-10 year US T-Bonds, while CBU7 and CU71 track shorter duration 3-7 year US T-Bonds.
- US corporate bonds: LQD, LQDA (LSE), IS01 (Gettex) and LQGH (LSE)
- Commodities: PDBC, WCOA (LSE), WTIC (Xetra) and WCOB (LSE)
- Gold: GLD, IGLN (LSE), EGLN (LSE) and SGLN (LSE)
Under no circumstances does this information represent an offer to sell, a solicitation to buy, or a recommendation regarding any securities transaction, and all data shown here should be subject to independent verification.
