We’ve added a new objective to the Portfolio Optimizer. Members can now find the combination of TAA strategies that would have maximized the Ulcer Performance Index (UPI), aka the “Martin Ratio”.
Members: begin exploring the Max UPI portfolios now.
UPI is a measure of return relative to drawdowns (i.e. losses). It captures both the length and severity of all drawdowns, not just the single worst drawdown. Learn more. As we’ve discussed before, if we had to pick just one measure of risk-adjusted return, we would choose UPI over more common alternatives like the Sharpe and Sortino Ratio.
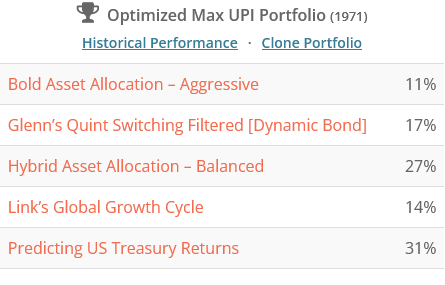
Here is a sample Max UPI portfolio:
There are all sorts of reasons you might not like every strategy in this list (and here’s a walk-through showing what you can do about that), but it does give you a feel for where the upper bound for UPI lays.
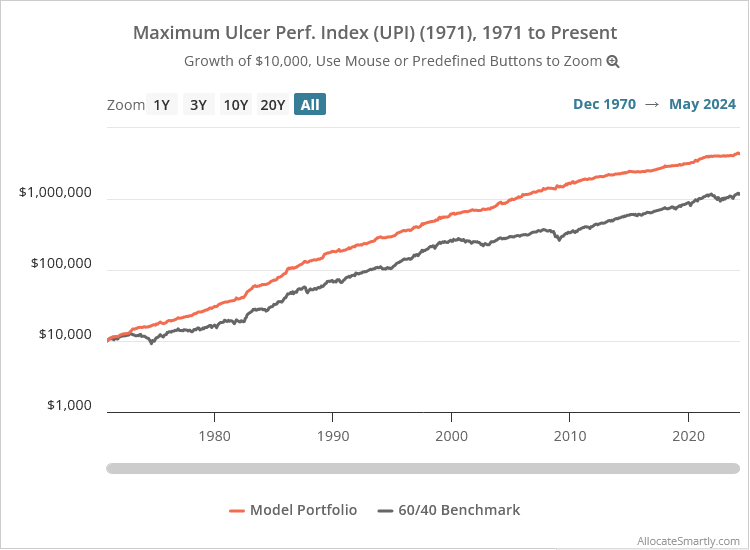
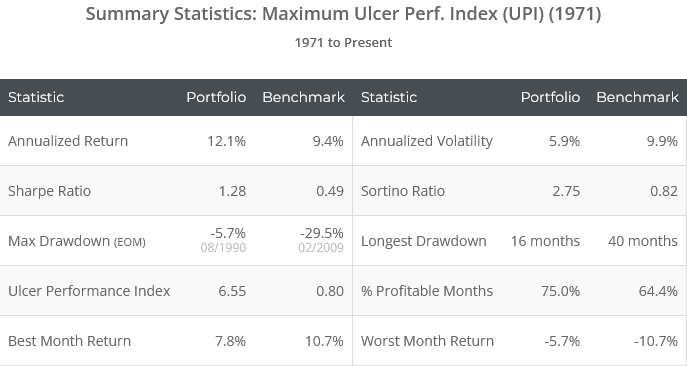
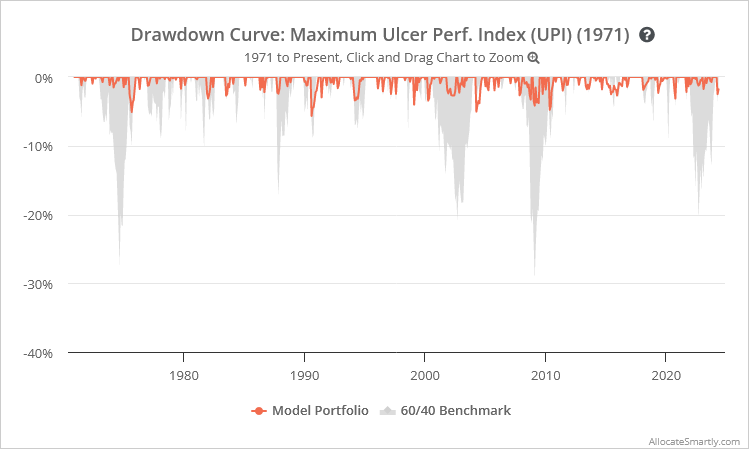
Historical results follow (note the UPI of 6.55). As one would expect from a Max UPI portfolio, drawdowns would have been extremely small and brief relative to return.

Logarithmically-scaled. Click for linearly-scaled results.
As a sanity check, we compared our Max UPI portfolios to the tens of thousands of Model Portfolios members have created. In terms of “fully allocated” portfolios (that phrase will become important in a moment), the Max UPI portfolios we’ve created have higher UPIs than anything yet created by members. That’s encouraging.
Some observations about Max UPI portfolios:
- While Max Sharpe and Max Sortino portfolios are often similar (because both use a measure of volatility to represent risk), Max UPI portfolios tend to be quite different. They also tend to be less volatile (ironically).
- The individual strategies chosen by the Max UPI portfolios often do not exhibit very high UPIs themselves. What’s important is that combined drawdowns are minimized relative to return.
-
Max UPI portfolios often include strategies with high exposure to gov. bonds (mostly US Treasuries) because gov. bonds have had reliably low drawdowns for most of the last 40+ years. In an era of rising interest rates, so much gov. bond exposure may not be optimal.Consider enabling the option to “avoid strategies with high exposure to rising rates”, or click “let me select strategies” to filter out strategies with egregious exposure.
One more observation (warning: a bit of geekiness ahead)…
Let’s say you started with a Max Sharpe portfolio. You then split your Model Portfolio in two, allocating half to the Max Sharpe portfolio and half to cash (or very short-term Treasuries like BIL). The resulting portfolio would have roughly the same Sharpe Ratio.
Why? The numerator in the Sharpe Ratio is excess return, i.e. return in excess of a risk-free rate, and the denominator is volatility. We use our cash asset as the risk-free rate. So, in our split portfolio, excess return is halved, but so is volatility, meaning the Sharpe Ratio is more or less unchanged.
We say “more or less” because there’s some impact from periodically rebalancing between the two halves, but let’s ignore that to keep things simple.
None of this is true for the Ulcer Performance Index. You can add cash or very short-term Treasuries to any portfolio and significantly increase the UPI.
Like the Sharpe Ratio, excess return is halved. But average drawdowns are better than halved because you have this zero-drawdown, return-generating asset perpetually working against the drawdown. If UPI used something like “drawdown in excess of cash” this wouldn’t be an issue, but it doesn’t, so it is an issue.
As a result, when choosing the option to “include buy & hold assets”, we don’t show cash. Literally any portfolio would benefit in terms of UPI by adding the maximum cash position, but in the real-world, that probably isn’t optimal for investors.
A special thank you to PortfolioOptimizer.io
Before committing the resources to adding this feature, we wanted to understand the types of portfolios a Max UPI optimization could generate. We turned to PortfolioOptimizer.io’s awesome API for our proof of concept.
Due to the unique complexity of our application (filtering down 80+ strategies to find the 10, 5 or 3 that have maximized the UPI) we had to build our own in-house optimizer, but PortfolioOptimizer.io’s API allowed us to do an initial mock-up with little effort.
These guys are good. If you’re an uber quant geek like us, we highly recommend checking them out.
Members: begin exploring the Max UPI portfolios now.
New here?
We invite you to become a member for about a $1 a day, or take our platform for a test drive with a free membership. Put the industry’s best Tactical Asset Allocation strategies to the test, combine them into your own custom portfolio, and follow them in real-time. Learn more about what we do.


