This is a deep dive into which share disposal method – FIFO or LIFO – would have been more tax advantageous for the 80+ asset allocation strategies we track.
When selling shares FIFO (first in, first out), the oldest shares held are sold first. When selling LIFO (last in, first out), the most recently purchased shares are sold first.
We find that the investor’s share disposal method would have had a major impact on tax efficiency, especially when combining multiple strategies together into a Model Portfolio, but that the best approach has been a mix of FIFO and LIFO.
Of course, this analysis is only relevant if trading in a taxable account.
1. Individual asset allocation strategies:
First, let’s look at the 87 Tactical Asset Allocation (TAA) strategies we track. These are median results and individual strategies will vary. Members: Click for individual strategy data.
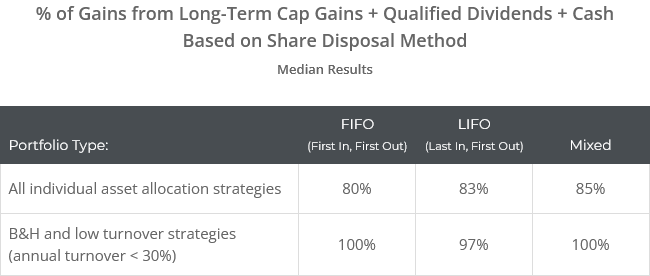
The table below shows the median strategy’s % of backtested gains from tax advantageous sources: long-term capital gains + qualified dividends + cash (*), depending on whether shares were disposed of FIFO, LIFO or mixed.
These results are not as stark as we’ll see with Model Portfolios, but there are still some useful nuggets here. We’ll cover why these results are the way they are later in this post. Generally speaking…
- LIFO has usually been more tax efficient than FIFO.
- An exception is buy & hold and very low turnover strategies. We track 7 strategies with annual turnover < 30%. For those 7 strategies, FIFO has been superior.
- In nearly all cases however, a “mixed” approach has been equally or more tax efficient than either FIFO or LIFO.
The mixed approach blends FIFO and LIFO: The earliest purchased shares were sold first (FIFO) if (a) the selling price was greater than the purchase price, and (b) the sale qualified as a long-term capital gain. Otherwise, the most recently purchased shares were sold first (LIFO).
For the geeks: See the calculation notes at the end of this article for more details about this analysis.
2. Model Portfolios (combinations of multiple strategies):
We are advocates for combining multiple strategies together into what we call Model Portfolios. Let’s look at the tax efficiency of FIFO vs LIFO when we combine strategies.
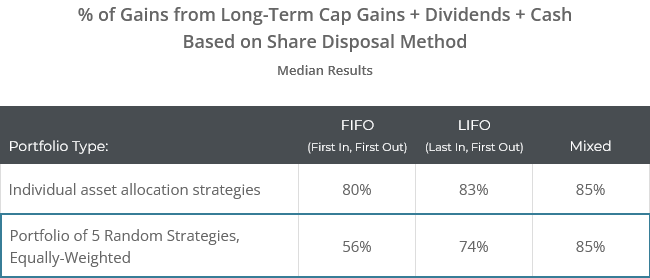
We created 1,000 portfolios, each with 5 TAA strategies randomly selected from the 80+ strategies we track (equally-weighted) (*). We then assumed an investor used one of the three approaches to share disposal: FIFO, LIFO or mixed. The median results for our 1,000 portfolios follow:
Here we see a much more distinct difference between the share disposal methods. LIFO has been much more tax efficient than FIFO, but only the mixed approach was able to match the tax efficiency of the individual strategies.
Again, we’ll cover why these results are the way they are later in this post.
3. For Model Portfolios, the tax efficiency of the individual strategies still trumps the share disposal method:
We don’t want to oversell the importance of FIFO vs LIFO. The most important factor in building a tax efficient Model Portfolio is still making sure that it includes strategies which themselves have been tax efficient.
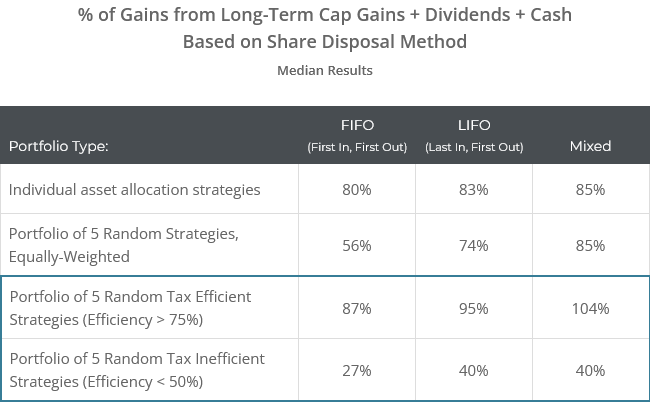
Below we created two additional sets of 1,000 portfolios of 5 TAA strategies each. The first set drew from more tax efficient strategies; those that exhibited a “mixed” score higher than 75% in section 1 of this analysis. The second set drew from tax inefficient strategies; those that exhibited a mixed score less than 50%.
These results show that our high-level conclusion still holds (Mixed >= LIFO > FIFO), but the much more impactful factor was the underlying strategies chosen.
? The why:
Consider three types of strategies. Each will vary in the tax efficiency of FIFO vs LIFO…
-
Buy & hold or other very low-turnover strategies, rebalanced periodically.
Advantage = FIFOAll sales are a result of small periodic rebalancing. By selling shares FIFO, those rebalancing sales are drawing from the earliest shares, and there’s a better chance that rebalancing purchases will be held long enough to eventually themselves qualify as long-term CGs. -
Active strategies that hold fixed position sizes, rebalanced periodically.
Slight advantage in most cases = LIFOSales are either the results of small periodic rebalancing or closing out positions entirely. An example is Faber’s classic GTAA 5, which allocates a fixed 20% to each active position.Both FIFO and LIFO will produce similar results because the bulk of sales happen all at once, but there may be a slight advantage to LIFO due to the small periodic rebalances. By executing those small rebalances from the most recent shares, we increase the likelihood that more of the initial position is able to eventually cross the long-term CG threshold. -
Active strategies that hold variable position sizes, as well as most Model Portfolios.
Significant advantage = LIFOThese strategies drastically change position sizes month-to-month, and eventually close out positions altogether. FinancialMentor.com’s Optimum3 is a good example. A better example for the purposes of this post is most members’ Model Portfolios.Selling shares LIFO tends to be significantly more tax efficient. By executing those changing position sizes month-to-month from the most recent shares, we increase the likelihood that more of the initial position is able to eventually cross the long-term CG threshold.
The “mixed” approach we detailed previously has usually been the best of all worlds, especially for Type 3 strategies (active w/ variable position size) and Model Portfolios. In the mixed approach, we draw from profitable long-term CGs first (FIFO), and then the most recently purchased shares (LIFO).
Two other notes:
- In some cases there is no advantage to FIFO vs LIFO, such as when a strategy always allocates 100% of the portfolio to a single asset (ex. VAA – Aggressive).
- The true best approach is the one that accounts for the investor’s entire taxable portfolio, including assets we don’t have visibility to. Here we’re modeling a mechanical rule that assumes knowledge of all assets, but in the real world that usually isn’t the case.
In summary – the very short version:
Mixed >= LIFO > FIFO
In summary – the slightly longer version:
For individual tactical strategies, generally speaking…
- LIFO has been more tax efficient than FIFO.
- An exception is B&H and very low turnover strategies, for which FIFO has been superior.
- In nearly all cases however, a “mixed” approach has been equally or more tax efficient than either FIFO or LIFO.
When combining strategies into Model Portfolios, generally speaking…
- The share disposal method has a larger impact than it does for most individual strategies.
- LIFO has been more tax efficient than FIFO, but a mixed approach has outperformed both.
- The choice of strategies included in the Model Portfolio is still the most important factor impacting tax efficiency.
Note that the conclusions above are based on long-term median results. They do not apply to every strategy or Model Portfolio, and in the short-term (like a particular year) tax efficiency could vary wildly from the high-level results presented here.
This is NOT tax advice (obviously):
We think this goes without saying, but just to be clear…
We are not accountants and this is not tax advice. Always consult your tax professional for specific guidance for your unique financial situation. You, and you alone, are solely responsible for any investment decisions that you make.
New here?
We invite you to become a member for about a $1 a day, or take our platform for a test drive with a free membership. Put the industry’s best Tactical Asset Allocation strategies to the test, combine them into your own custom portfolio, and follow them in real-time. Learn more about what we do.
* * *
(*) Calculation notes:
- Our definition of short vs long-term capital gains is based on US tax laws as they stand today.
- Qualified vs ordinary dividends are defined solely based on how long each position was held relative to the ex-dividend date, and does not account for whether a particular ETF or a particular distribution was eligible.
- “Cash” accounts for roughly 4% of the median strategy’s historical return, and could qualify as dividends, interest and/or cap gains depending on what asset an investor employed (read more).
- The Model Portfolio analyses in sections #2 and #3 make some simplifying assumptions:
- All Model Portfolios started in 1991 (the latest start date of any strategy we track), and exclude the 5 strategies we track that are categorized as daily strategies.
- Unlike the individual strategy analysis in section #1, our Model Portfolio analysis does not distinguish between qualified and ordinary dividends. Had we made that distinction, the advantage of LIFO over FIFO would have been a bit smaller, but not by enough to change the fundamental conclusions presented.
- When a tax efficiency value exceeded 100% (as we saw with tax efficient Model Portfolios w/ mixed shared disposal), it means that in that scenario there were net short-term losses, i.e. short-term losses exceeded short-term gains.
- This analysis does not account for wash sales.


