This is a test of Meb Faber’s “Tactical Yield” from T-Bills and Chill…Most of the Time.
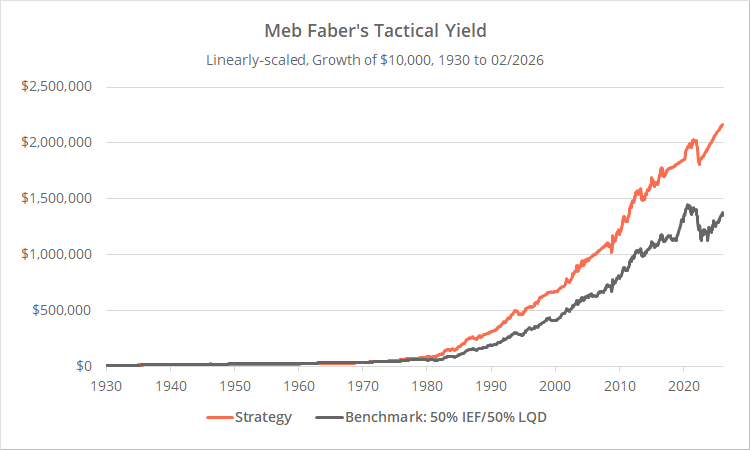
Backtested results from 1930 follow compared to a benchmark of 50% int-term US Treasuries (IEF) and 50% US corporate bonds (LQD). Results are net of transaction costs – see backtest assumptions. Learn about what we do and follow 100+ asset allocation strategies like this one in near real-time.
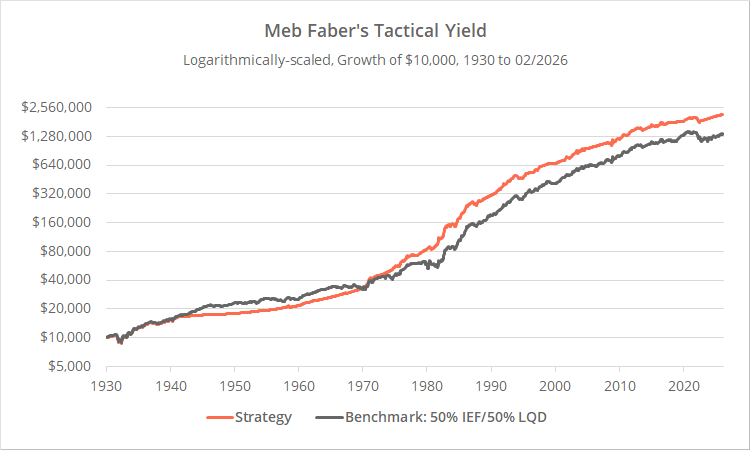
Logarithmically-scaled. Click for linearly-scaled results.
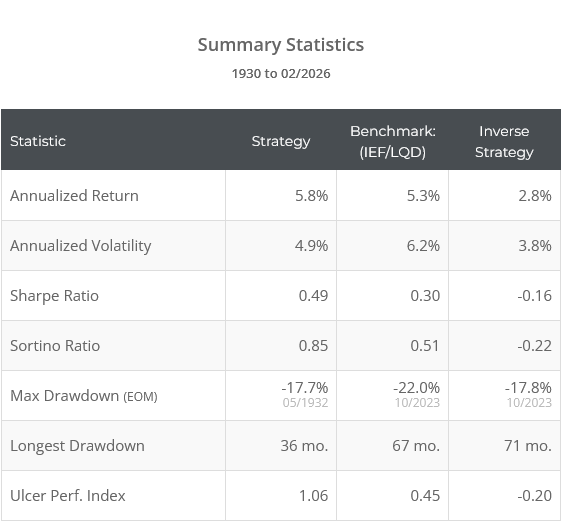
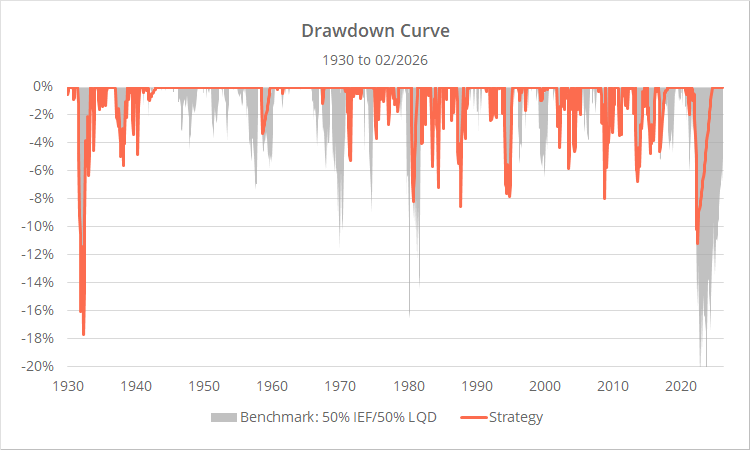
Clearly, the purpose of Tactical Yield hasn’t been generating outsized returns. It’s simply been a smarter approach to bond exposure. It has generated bond-like returns, but at substantially less risk. To further demonstrate the strategy’s benefit, below we’ve also included the inverse strategy rules, which are in the market about the same amount of time.
Strategy premise:
We know that long-term returns for US Treasury funds are quite predictable. For a 10-year Treasury fund (ex. IEF), the initial 10-year yield has predicted about 86% of the total return over the subsequent 10 years. That % is even higher for shorter duration Treasuries.
There will be some deviation from the initial estimate based on how yields change over time. That’s a risk. Faber’s strategy essentially asks whether the “term premium” is sufficient to justify taking that risk. If it’s not, we should simply hold risk-free T-Bills.
Faber tested multiple variations of this concept. We are focusing on two assets: 10-year US Treasuries (represented by IEF) and US corporate bonds (LQD).
Strategy rules:
At the close on the last trading day of the month, measure two premiums:
- Term premium: Difference in yield between 10-year and 3-month US Treasuries
- Credit premium: Difference in yield between investment grade corporate bonds and 3-month US Treasuries
If the term premium is in the top half of history, measured up to that moment in time (no lookahead bias), allocate 50% of the portfolio to US Treasuries (IEF).
Likewise, if the credit premium is in the top half of history, measured up to that moment in time (no lookahead bias), allocate 50% of the portfolio to US corporate bonds (LQD).
Unallocated funds remain in cash. Hold all positions until the end of the following month. We’ve assumed the portfolio is rebalanced monthly, even if there is no change in position.
Sometimes simple is best:
This strategy makes intuitive sense.
It’s another approach to determining whether there is justification for longer duration bonds. Strategy developers usually use a trend-following approach, which has its benefits, but ignores potential risks that the trend doesn’t capture.
A more sophisticated approach would take into account how high/low current yields are (regardless of the premium over T-Bills), because as we know, point for point, changing yields have an outsized impact when starting yields are low.
An opportunity for overfitting?
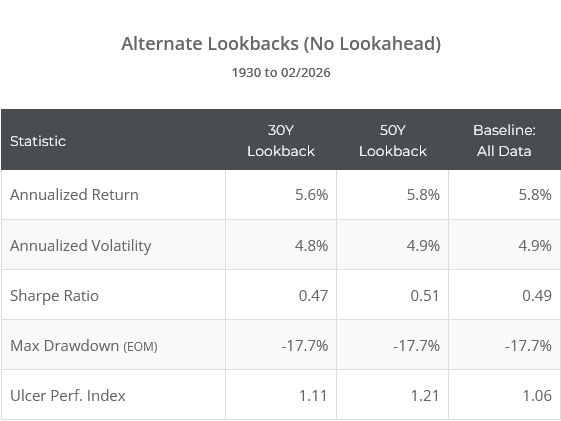
The strategy considers yields up to that moment in time to determine how high or low each premium is. Does the start date of our data create an opportunity for overfitting? In other words, would these results have been different if our data had started from some other date? The short answer is no.
In the table below, we test versions of the strategy that compare premiums to the previous 30 and 50 years (rather than all data to that point in time). No significant difference in performance.
Nothing magical about the “top half”:
The strategy sets the premium cutoff at the “top half” of historical observations as of that moment in time. There’s nothing magical about that cutoff. In the table below, we test versions of the strategy setting the cutoff at between 30 and 70%.
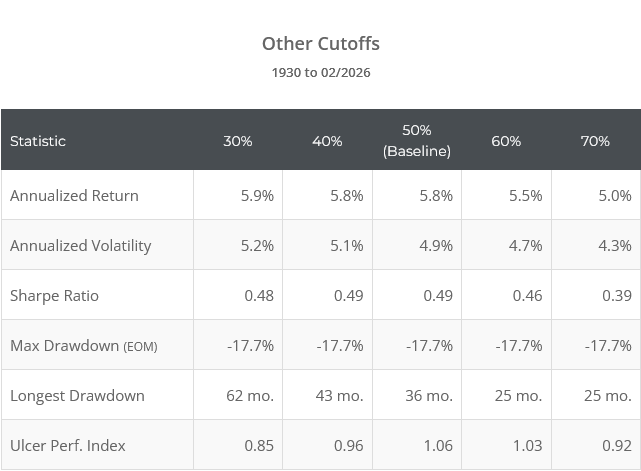
The less strict the threshold (30 and 40%), the more the risk (volatility rises, duration of drawdowns increases, see UPI). The stricter the threshold (60 and 70%), the less the risk, but total return and risk-adjusted return metrics like Sharpe deteriorate. That matches what you would intuitively expect.
The 50% cutoff is a nice middle ground but isn’t set in stone. Investors could turn the dial up or down depending on the investment objective.
Outro:
More than anyone else, Meb Faber is responsible for popularizing Tactical Asset Allocation as a trading style, including many of the fundamental concepts used today. This is another of his simple but effective ideas.
We realize that for traditional buy & hold investors, TAA strategies that shift the entire portfolio multiple times throughout the year are a bit intense. There’s a degree of anxiety that comes with deviating from a diversified buy & hold portfolio. We get that.
But something like this strategy, which is grounded in common sense, trades infrequently, and never deviates very far from B&H returns, seems like an easy bare minimum approach to tactical investing.
That’s doubly true for Treasury funds, whose future returns are especially predictable. For long-term buy & hold’ish investors, when term spreads are super low (as they are now), why would we accept the interest rate risk of long duration Treasuries and not simply T-Bills and chill?
New here?
We invite you to become a member for about a $1 a day, or take our platform for a test drive with a free membership. Put the industry’s best tactical asset allocation strategies to the test, combine them into your own custom portfolio, and follow them in real-time. Learn more about what we do.

Calculation note: There is some discrepancy between our results and Meb’s very early in the test, especially around 1932. We chalk that up to different data sources and different start dates for measuring median premium values. Estimating yields so far in the past is inherently uncertain. We think both our test and Meb’s represent good faith efforts. Any differences between them is attributable to different data sources and/or noise.