We track more than 60 Tactical Asset Allocation strategies. Members can combine those strategies into what we call “Model Portfolios”. Combining strategies in this way reduces the risk of any single strategy going off the rails and helps to provide smoother, more consistent investment returns.
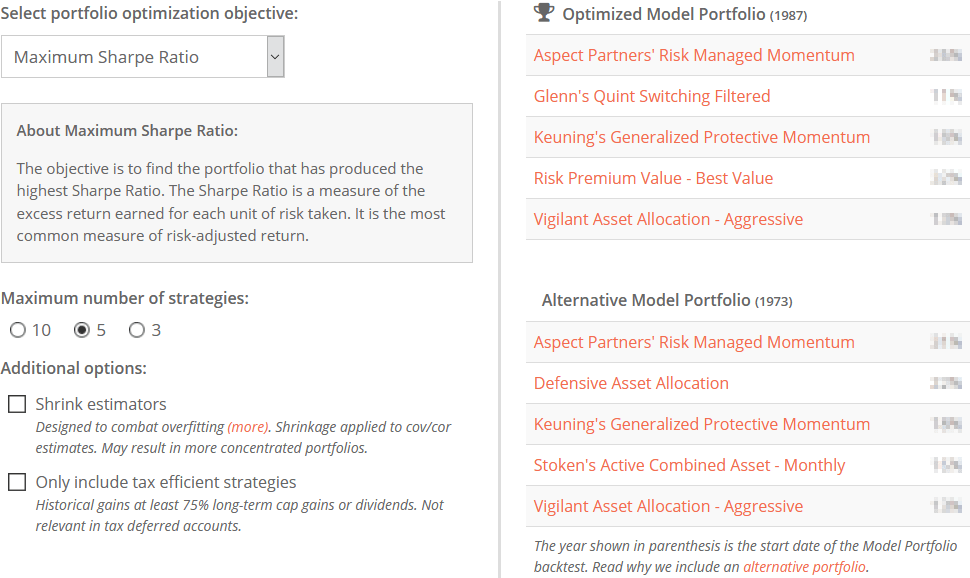
But deciding which strategies to trade in your Model Portfolio and how much to allocate to each can be daunting. The sheer volume of data on our platform can be overwhelming for a new user. In response, we’ve launched a new feature designed to make the first steps in building Model Portfolios a little simpler by showing combinations that have been optimal in the past. A screenshot follows:
[click image to zoom]
There is no one definition of the “optimal Model Portfolio”. It depends on what you’re trying to accomplish. We include 7 possible optimization objectives, from maximizing return relative to risk (Maximum Sharpe Ratio) to minimizing volatility (Minimum Variance) to minimizing correlation between strategies (Maximum Diversification).
Should the investor blindly follow the resulting portfolio? Of course not. There are all sorts of factors that may be important to an investor that this tool does not consider.
Perhaps the member prioritizes minimizing exposure to rising interest rates (there’s a report for that) or maximizing safe withdrawal rates (there’s a report for that too) or has some other unique approach to judging strategies. The possibilities are endless. The point is that these results should be considered a starting point in your research.
At the very least, these results show where the upper limits are on what a user can expect from combining strategies. Want to know how your Model Portfolio’s Sharpe Ratio (or volatility, etc.) compares to the best possible historically? You can do that now by comparing it to the relevant optimization objective.
Shrinking Estimators
We would highly encourage members to experiment with the “shrink estimators” option. It’s an odd name for a simple and powerful concept.
All of these optimization objectives require as input a correlation or covariance matrix, showing to what degree each strategy moves in tandem with every other strategy. Finding strategies that zig when other strategies zag is key to diversification and risk control.
These correlation/covariance estimates are based on the past. How well will they reflect the future, especially during crisis points when they matter most? No one can say for sure. By shrinking the estimates, we assume that strategies are a bit more correlated than they have been historically. That may result in portfolios that are more robust to an uncertain future.
Two other observations about shrinking estimators:
-
When shrinking estimators, you’ll notice different strategies bubbling to the top of portfolios. Our own Meta Strategy is a good example.As a general concept, portfolio optimization favors strategies that behave very differently than other strategies in the portfolio, because the more unalike the strategies are, the more risk is reduced.Our Meta Strategy is, by definition, a little bit of everything, so despite strong historical performance, it will rarely be chosen by the optimizer. When shrinking the estimators, we’re assuming a little less confidence in the degree of future diversification, making broader strategies like Meta more likely to be chosen.
- If you test a shrunk portfolio, it will perform “worse” historically than a non-shrunk portfolio, because it’s not fully exploiting historical diversification. But that’s not necessarily relevant. The only thing that matters is future performance, and conceptually, these shrunk portfolios are more robust to an uncertain future.
Next steps:
There’s a lot we’d like to do with this new portfolio optimization feature in the future. The core data is sound – that was the hard part – but we can do more to make it more visually useful. Ideas include providing a backtest with each optimized portfolio and a risk-return scatterplot (like this one) showing how the optimized portfolio compares to the individual strategies we track. Stay tuned for future updates. As always, your comments and feedback are welcome.
Members, visit your new Optimized Model Portfolios tool now.
New here?
We invite you to become a member for about a $1 a day, or take our platform for a test drive with a free limited membership. Put the industry’s best tactical asset allocation strategies to the test, combine them into your own custom portfolio, and follow them in near real-time. Not a DIY investor? There’s also a managed solution. Learn more about what we do.

