We’ve radically redesigned the charts we use to show backtested performance throughout the member’s platform. At first glance, the new charts look familiar, but there are a ton of useful ways members can now manipulate them.
Let’s look at four new features:
- Zoom by predefined periods, with rebasing to $10,000
- Zoom by specific start and end dates, with rebasing
- Zoom by mouse, with rebasing
- Rolling performance comparisons
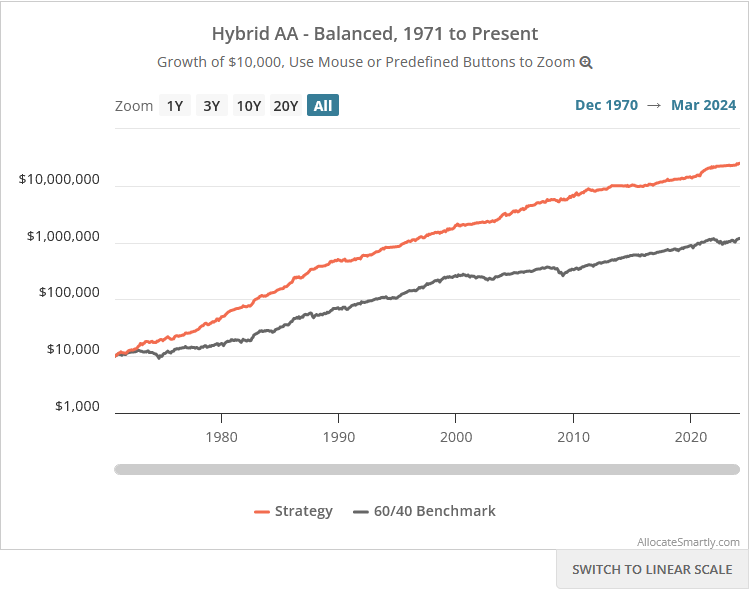
1. Zoom by predefined periods, with rebasing to $10,000
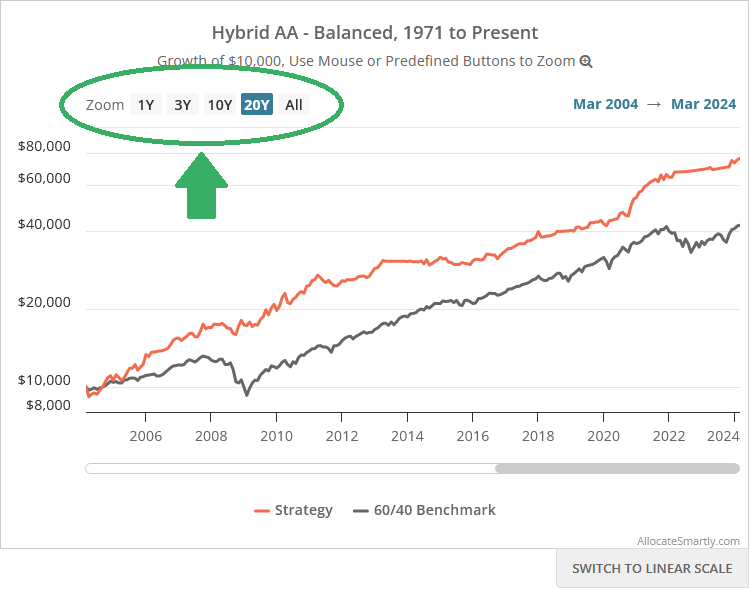
Member selects a predefined period of 1, 3, 10 or 20 years. We show performance over that period of time.
Importantly, we rebase the chart, meaning the chart assumes we started at the beginning of the member-selected period with $10,000. That makes it easier to compare two or more equity curves, such as a strategy versus its benchmark.
2. Zoom by specific start and end dates, with rebasing to $10,000
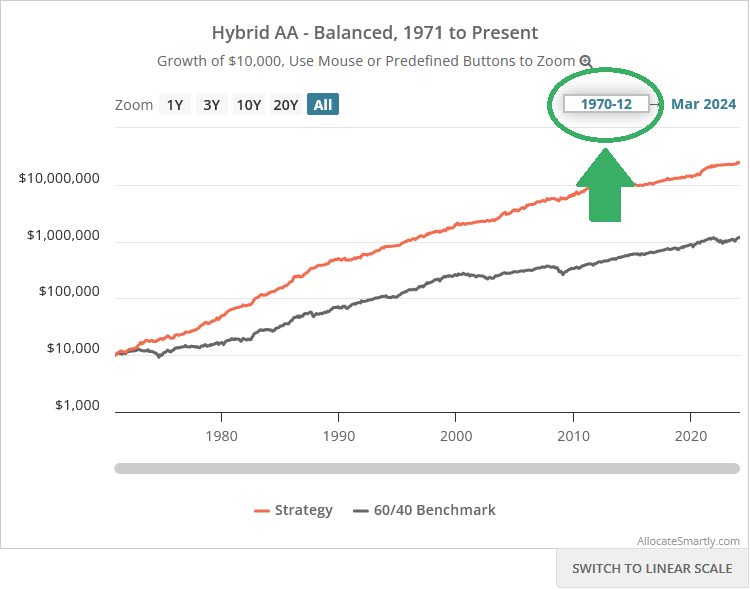
Member selects the start and end dates of the chart. We show performance over that period of time. As with feature #1, we rebase the chart, meaning the chart assumes we started at the beginning of the member-selected period with $10,000.
Note that all performance charts show month-end data. The member specifies a year and month in the format YYYY-MM (4 digit years, 2 digit months), followed by the enter key.
If the member wanted to show data for all of 1970, the start date would be 1969-12, because all 1970 performance is relative to the last trading day of 1969. The end date would be 1970-12, as that would cover returns up to the last trading day of 1970.
3. Zoom by mouse, with rebasing to $10,000
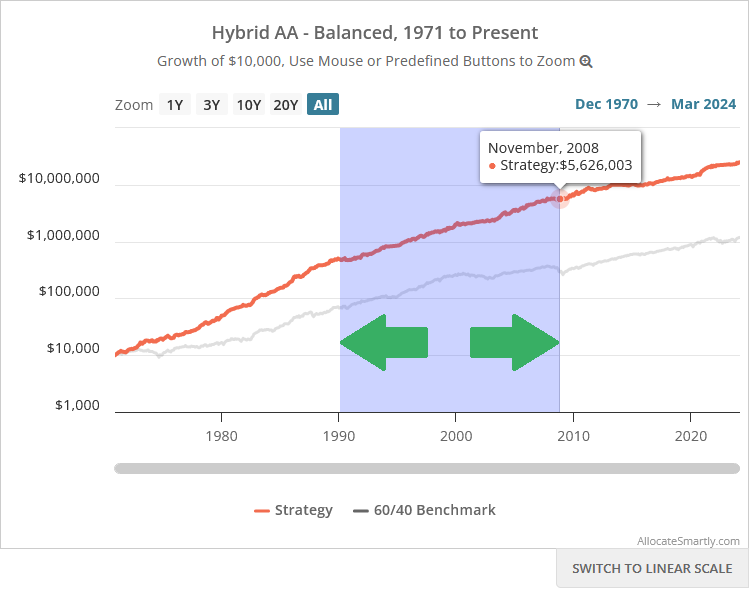
The member uses their mouse to click and drag over any part of the chart. We show performance over that period of time. As with features #1 and #2, we rebase the chart, meaning the chart assumes we started at the beginning of the member-selected period with $10,000.
4. Rolling performance comparisons
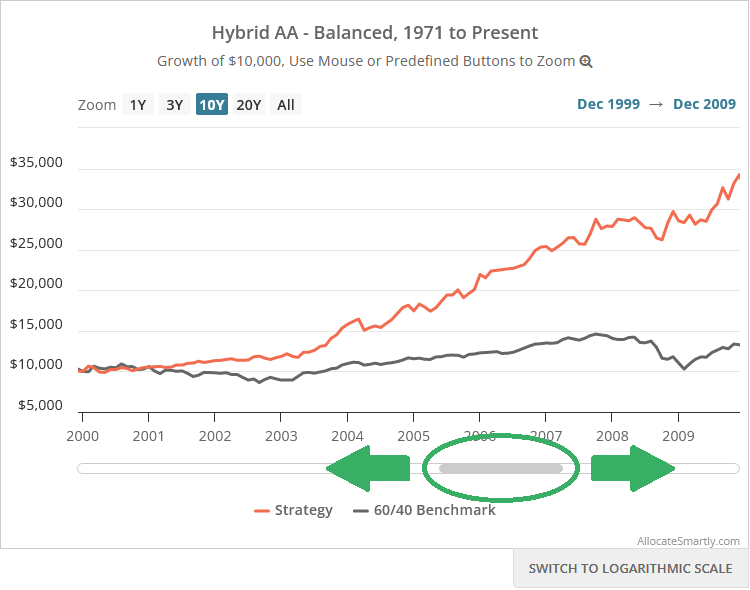
First, a member zooms in on the chart, using one of the 3 methods shown so far. The member-selected period might cover a few months or multiple decades. The member can then use the slider at the bottom of the chart to show rolling performance over that same length of time.
For example, the member could use the predefined buttons to zoom in on the last 10 years. The member could then use the slider to show all 10-year periods throughout the backtest.
As with all previous features, as the member slides back and forth, we continuously rebase the chart to $10,000.
An important note about very recent strategy performance:
We worry that by making it easier to model very recent strategy performance (say, anything less than 3 years), we’re encouraging members to chase whatever strategy has the hot hand at that moment.
We’ve shown previously that this is a suboptimal approach. While recent returns are interesting, our focus should be on long-term performance, because that’s more predictive of future results.
Your feedback is welcome:
From a technical perspective, this is quite a departure from our previous performance charts. We feel confident about the accuracy of the data (the most important part), but we expect there will be some tweaking as we learn how to best serve members’ needs.
Your questions and feedback are welcome.
New here?
We invite you to become a member for about a $1 a day, or take our platform for a test drive with a free membership. Put the industry’s best Tactical Asset Allocation strategies to the test, combine them into your own custom portfolio, and follow them in real-time. Learn more about what we do.
