The inspiration for this post comes from a new paper titled Predictable End-of-Month Treasury Returns (h/t Capital Spectator). A description from the authors:
We document a distinct pattern in the timing of excess returns on coupon Treasury securities. Average returns are positive and highly significant in the last few days of the month and are not significantly different from zero at other times. A long Treasury position for just the last few days of each month gives a high annualized Sharpe ratio of around 1.
In this post we look at whether this same end-of-month dynamic exists in Treasury ETFs like TLT and IEF. In short: It does (with some caveats), but the effect may be even easier to trade as a “second half of the month” effect.
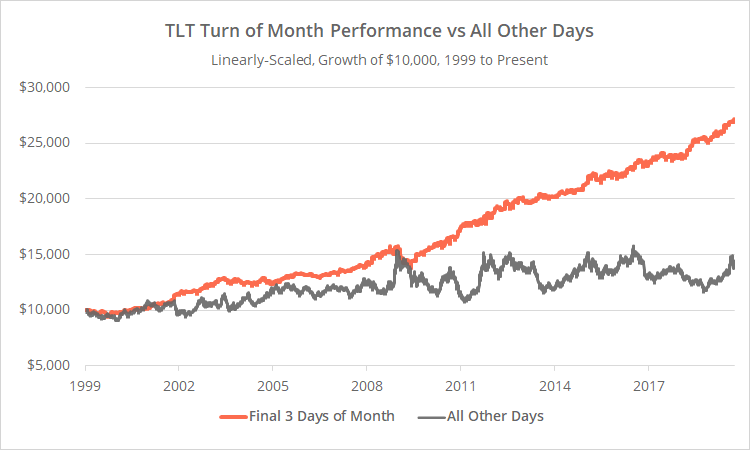
First, let’s look at the performance of TLT, a 20+ Year US Treasury Bond ETF, in the final three trading days of the month (orange) versus all other days (grey) since 1999. (*)

Linearly-scaled. Click for logarithmically-scaled chart.
Clearly, returns have been more consistently positive in the final three days of the month, with 58% of these end-of-month days closing up (versus 52% of other days) and an average daily return of 0.13% (versus 0.01%).
Focusing in on just the last three days of the month:
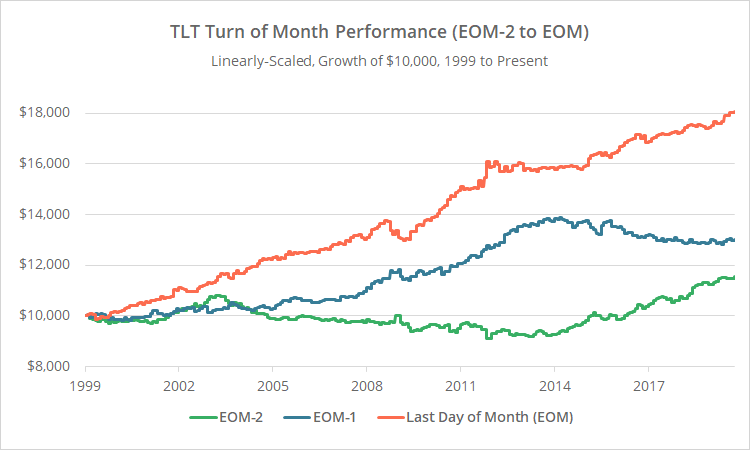
In the graph below we focus in on TLT’s performance on each of these three end-of-month days: the last day of the month (EOM, orange), EOM – 1 (blue) and EOM – 2 (green).
The very last day of the month (orange) has been consistently positive. Interestingly, the second to last day (blue) showed similar positive returns up until 2014, when that positive bias began to slide back one day earlier (green). This is not uncommon with strong seasonal biases, as traders begin to trade earlier and earlier to preempt the trade.

Linearly-scaled. Click for logarithmically-scaled chart.
“Last half of the month” seasonality:
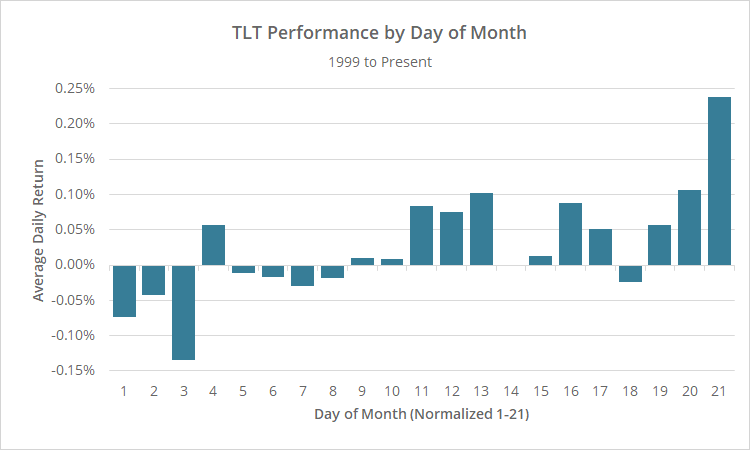
In the graph below, we’ve shown average TLT returns for every day of the month since 1999. As we often do in our analyses, we’ve normalized every month to have exactly 21 trading days (read more). Day 1 is always the first day of the month, and day 21 is always the last.
Note that while the last three days of the month have been positive on average, the bias in these ETFs really seems to be in the last half of the month.
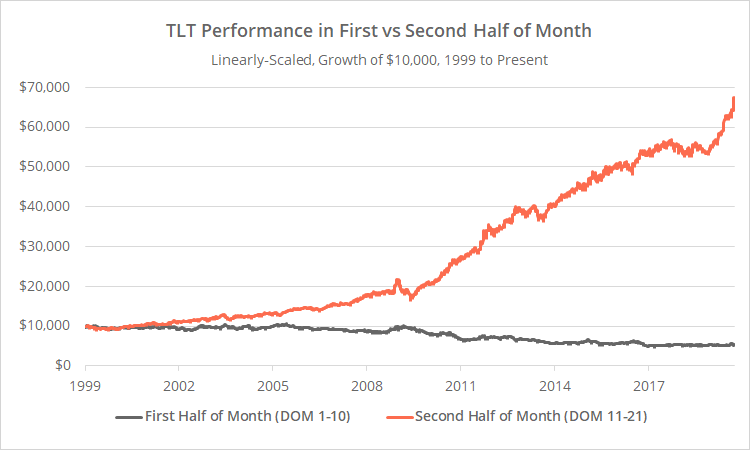
The effect has been consistent over time. To demonstrate, below we’ve assumed that an investor held TLT on either days 11-21 (orange) or days 1-10 (grey). The consistency and magnitude of the difference speaks for itself.

Linearly-scaled. Click for logarithmically-scaled chart.
Depending on the situation (desired hold times, trading frictions, etc.), it may make more sense to consider this a “last half of the month” seasonality in ETFs, rather than limit it to just the last three days of the month.
More thoughts:
First, we’ve focused on TLT here, but the effect can be observed in other shorter duration ETFs like IEF (7-10 Year UST) and SHY (1-3 Year UST). Importantly however, as the duration shortens so does the magnitude of the effect. That makes sense. Longer duration Treasuries are more sensitive to changes in interest rates, especially in the short timeframes considered here.
Second, these results do not take trading frictions (transaction costs and slippage) into account; we’ve just focused on the seasonality. We wouldn’t recommend trading this observation as a standalone strategy, but if we did, trading frictions would definitely need to be considered and might take a significant bite out of the results shown here.
We think this observation is more useful as one of many inputs into a tactical asset allocation strategy. Long-term seasonalities (like “Sell in May”) are probably too weak and too inconsistent to be taken too seriously as an input, but shorter-term seasonalities like the one shown here (or similar turn-of-month seasonalities in equities) might be worthwhile.
New here?
We invite you to become a member for about a $1 a day, or take our platform for a test drive with a free limited membership. Put the industry’s best tactical asset allocation strategies to the test, combine them into your own custom portfolio, and then track them in near real-time. Have questions? Learn more about what we do, check out our FAQs or contact us.
(*) Throughout this post, prior to the launch of TLT and IEF in mid-2002, we use the indices DBUS20VL and LT09TRUU respectively to represent ETF returns. All days are measured close-to-close.

