• Skip to primary navigation
  • Skip to main content
  • Skip to primary sidebar
  • Skip to footer

Allocate Smartly

  • About
    • What We Do
    • List of Strategies
    • Advanced Features
    • 19 Core Ideas
    • FAQs
    • Contact Us
  • Subscribe
  • Blog
  • Members

Tactical Asset Allocation in April

April 29, 2017

This is a summary of the recent performance of a wide range of excellent tactical asset allocation strategies. These strategies are sourced from books, academic papers, and other publications. While we don’t (yet) include every published TAA model, these strategies are broadly representative of the TAA space. Read more about our backtests or let AllocateSmartly help you follow these strategies in near real-time.

Recent Performance of Asset Allocation Strategies
Use the Arrows to Sort This Table
Strategy Apr YTD
Composite Dual Momentum 1.76% 8.57%
Elastic Asset Allocation – Offensive 1.64% 6.79%
Flexible Asset Allocation 1.64% 1.27%
Varadi’s Minimum Correlation Portfolio 1.56% 7.51%
Protective Asset Allocation 1.45% 4.52%
Elastic Asset Allocation – Defensive 1.38% 6.74%
Faber’s Global Tactical Asset Alloc. – Agg. 6 1.34% 4.62%
Robust Asset Allocation – Aggressive 1.27% 6.52%
Browne’s Permanent Portfolio 1.10% 5.18%
US Max Diversification 1.07% 3.81%
Keuning’s Generalized Protective Momentum 1.06% 3.15%
Faber’s Sector Relative Strength 1.04% 3.29%
60/40 Benchmark 1.04% 5.03%
Dalio’s All-Weather Portfolio 1.04% 4.02%
US Max Sharpe 1.04% 4.91%
US Equal Risk Contribution 1.02% 3.23%
US Min Correlation 1.02% 3.79%
Faber’s Global Tactical Asset Alloc. – Agg. 3 1.01% 2.64%
Davis’ Three Way Model 0.99% 6.97%
Traditional Dual Momentum 0.99% 6.97%
Glenn’s Paired Switching Strategy 0.99% 6.97%
Philosophical Economics’ Growth-Trend Timing 0.99% 6.97%
PortfolioCharts’ Golden Butterfly 0.98% 4.19%
Protective Asset Allocation – CPR 0.94% 3.63%
Stoken’s Active Combined Asset 0.94% 3.79%
Varadi’s Percentile Channels 0.90% 1.87%
Faber’s Ivy Portfolio 0.48% 2.82%
Faber’s Global Tactical Asset Alloc. 13 0.41% 2.59%
Novell’s Tactical Bond Strategy 0.28% 1.14%
Global Risk Parity Trend Following 0.24% 1.61%
Adaptive Asset Allocation 0.23% 4.28%
Robust Asset Allocation – Balanced 0.19% 2.22%
Faber’s Global Tactical Asset Alloc. 5 0.15% 1.58%
US Risk Parity Trend Following 0.04% 1.18%

Commentary:

Tactical asset allocation turned in a solid performance in April, with positive results across the board. It was hard to go horribly wrong, with nearly all significant asset classes up for the month.

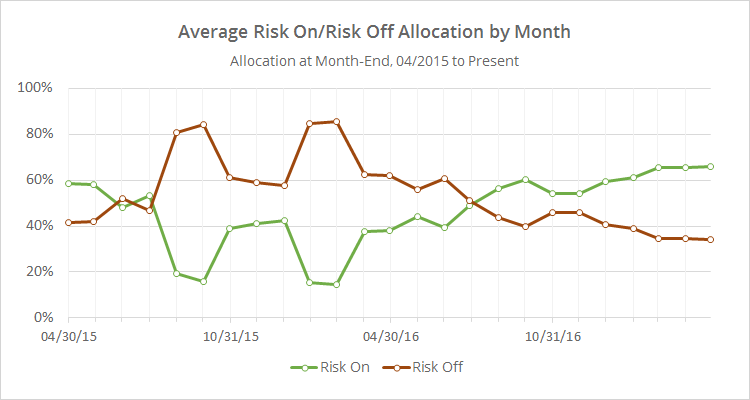
The most notable exception was diversified commodities (DBC, -2.7%), which was down for the fourth month in a row. The strategies that we track have now reduced exposure to commodities to near zero.

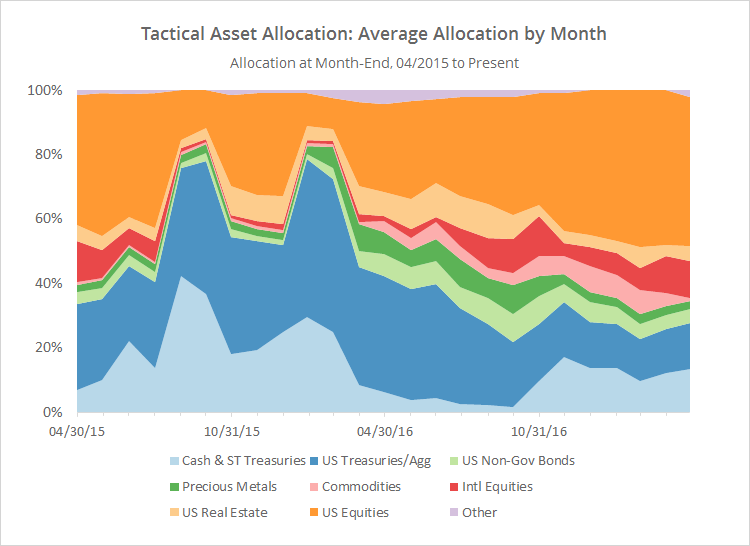
The chart below shows the average allocation over the last two years to broad categories of assets by the 34 strategies that we track, as of the end of each month (for a longer view, see this post). For example, “US Equities” may include everything from the S&P 500 to individual stock market sectors.

Below I’ve combined the average TAA allocation into even broader categories: “risk on” (equities, real estate and high yield bonds) versus “risk off” (everything else). I realize that some asset classes don’t fit neatly into these buckets, but it makes for a useful high level view. Exposure to risk assets is now at a sample high, and looking even further into history, it’s at the highest point since mid-2007.

As previously mentioned, while we don’t (yet) track every published tactical asset allocation model, the 34 strategies that we do track are broadly representative of the TAA space, and I think it’s fair to make some broader commentary based on this data.

That commentary has remained essentially the same over the last few months: tactical asset allocation is very bullish on risk, and is bumping up against historically high levels of exposure to risk assets. That’s great if this broad rally continues, but there is significant exposure to investors here if the market stumbles in May.

We invite you to become a member for less than $1 a day or take our platform for a test drive with a free limited membership. Track the industry’s best tactical asset allocation strategies in near real-time, and combine them into custom portfolios. Have questions? Learn more about what we do, check out our FAQs or contact us.

Filed Under: TAA Performance

Previous Post
Next Post

Primary Sidebar

About Us

We have built a platform to track the industry's best Tactical Asset Allocation strategies in near real-time, and combine them into custom portfolios.

Learn about what we do or take our platform for a free test drive.

Follow Our Blog

Recent Posts

  • Front-Running Seasonality in Country ETFs: An Extended Test
  • New Feature: Walked-Forward Optimal Strategy Combinations (aka “Meta Walk-Forwards”)
  • Walking Forward Optimal Strategy Combinations
  • Taming Excessive “Timing Luck” in TAA by Tranching Strategies
  • Piard’s Annual Seasonality

Categories

Footer

About Us

We have built a platform to track the industry's best Tactical Asset Allocation strategies in near real-time, and combine them into custom portfolios.

Learn about what we do and take our platform for a free test drive.

New from Our Blog

  • Front-Running Seasonality in Country ETFs: An Extended Test April 29, 2025
  • New Feature: Walked-Forward Optimal Strategy Combinations (aka “Meta Walk-Forwards”) April 22, 2025
  • Walking Forward Optimal Strategy Combinations March 31, 2025

Helpful Links

  • What We Do
  • List of Strategies
  • Advanced Features
  • Subscribe
  • Blog
  • FAQs
  • Contact Us
  • Member Login

Stay Informed

Follow the latest research from our blog via Twitter, RSS and email:

© 2025 Allocate Smartly. All rights reserved.
  • Affiliates
  • Terms of Service
  • Privacy