• Skip to primary navigation
  • Skip to main content
  • Skip to primary sidebar
  • Skip to footer

Allocate Smartly

  • About
    • What We Do
    • List of Strategies
    • Advanced Features
    • 19 Core Ideas
    • FAQs
    • Contact Us
  • Subscribe
  • Blog
  • Members

Tactical Asset Allocation in December

January 2, 2018

Blogging was light in December. We spent the month working on the launch of a new fintech project that many of our readers will be excited about. We’ll be sharing details in the coming month and getting back to our regular blogging and site development schedule. — Allocate Smartly

This is a summary of the recent performance of a wide range of excellent tactical asset allocation strategies. These strategies are sourced from books, academic papers, and other publications. While we don’t (yet) include every published TAA model, these strategies are broadly representative of the TAA space. Learn more about what we do or let AllocateSmartly help you follow these strategies in near real-time.

Recent Performance of Asset Allocation Strategies
Use the Arrows to Sort This Table
MTD/YTD Return Adjusted for Timing Luck (*)
Strategy Dec YTD Dec YTD
Flexible Asset Allocation 1.78% 12.72% 1.47% 16.98%
Davis’ Three Way Model 1.71% 14.33% 1.73% 14.31%
Global Risk Parity Trend Following 1.60% 10.26% 1.59% 10.28%
Classical Asset Allocation – Defensive 1.57% 20.66% 1.49% 17.61%
Classical Asset Allocation – Offensive 1.57% 26.67% 1.50% 25.32%
Adaptive Asset Allocation 1.54% 14.85% 1.63% 14.87%
Dalio’s All-Weather Portfolio 1.47% 11.89% 1.47% 11.89%
Faber’s Sector Relative Strength 1.45% 12.51% 0.28% 13.74%
Faber’s Trinity Portfolio Lite 1.44% 14.64% 1.40% 13.91%
Novell’s Tactical Bond Strategy 1.42% 5.18% 1.25% 3.94%
Composite Dual Momentum 1.42% 12.25% 1.35% 11.80%
Traditional Dual Momentum 1.35% 18.74% 1.35% 18.81%
Browne’s Permanent Portfolio 1.33% 11.15% 1.33% 11.15%
Protective Asset Allocation – CPR 1.23% 14.39% 1.16% 14.10%
Protective Asset Allocation 1.23% 15.66% 1.16% 16.48%
Glenn’s Paired Switching Strategy 1.21% 12.70% 1.21% 14.42%
Philosophical Economics’ Growth-Trend Timing 1.21% 21.71% 1.21% 21.71%
Varadi’s Minimum Correlation Portfolio 1.20% 15.43% 1.29% 16.01%
Faber’s Global Tactical Asset Alloc. 13 1.18% 10.55% 0.90% 9.37%
Varadi’s Percentile Channels 1.13% 8.54% 1.06% 7.50%
Faber’s Global Tactical Asset Alloc. – Agg. 3 1.09% 16.78% 1.29% 15.28%
Faber’s Ivy Portfolio 1.08% 11.81% 1.08% 11.81%
Faber’s Global Tactical Asset Alloc. 5 1.06% 8.97% 1.02% 8.15%
Stoken’s Active Combined Asset – Monthly 1.06% 11.02% 1.07% 11.03%
Vigilant Asset Allocation 1.01% 14.08% 1.01% 14.56%
Allocate Smartly’s Meta Strategy 0.98% 13.64% 0.98% 13.64%
Robust Asset Allocation – Balanced 0.98% 10.35% 0.91% 8.86%
Robust Asset Allocation – Aggressive 0.97% 19.28% 0.95% 18.71%
Stoken’s Active Combined Asset 0.97% 11.92% 0.97% 11.92%
US Max Sharpe 0.91% 14.28% 0.83% 12.67%
Elastic Asset Allocation – Offensive 0.89% 20.15% 1.23% 20.47%
Elastic Asset Allocation – Defensive 0.88% 18.68% 1.34% 20.46%
Faber’s Global Tactical Asset Alloc. – Agg. 6 0.88% 16.24% 0.81% 14.77%
PortfolioCharts’ Golden Butterfly 0.85% 10.33% 0.85% 10.33%
60/40 Benchmark 0.80% 13.70% 0.80% 13.70%
US Min Correlation 0.73% 10.10% 0.71% 9.49%
Tactical Permanent Portfolio 0.72% 10.33% 0.31% 9.69%
US Risk Parity Trend Following 0.72% 7.58% 0.55% 6.11%
US Equal Risk Contribution 0.68% 8.40% 0.67% 8.18%
US Max Diversification 0.54% 8.92% 0.54% 8.64%
Keuning’s Generalized Protective Momentum 0.54% 14.20% 0.97% 9.89%
(*) “Timing Luck” describes the randomness that is introduced simply by the day of the month that an investor chooses to trade a monthly strategy. We believe that these adjusted figures are a more useful representation of the recent “health” of each strategy (read more).

Commentary:

It was a strong month for tactical asset allocation. Like much of this year, it was hard to go horribly wrong, with most major asset classes up for the month. Notable winners included both offensive and defensive asset classes, ranging from emerging market equities (ex. EEM +3.76%) to commodities (DBC +2.78%) and gold (GLD +2.11%).

For the year, “Classical Asset Allocation” from Dr. Wouter Keller, Adam Butler and Ilya Kipnis earned the top spot. In terms of simply return, the “offensive” version of the strategy led the field at +26.7%, but in terms of return relative to historical volatility (likely a better judge of a strategy’s recent performance), the “defensive” version was the site’s top performer at +20.7%. That’s especially impressive for a strategy that has exhibited uber conservative historical volatility about a third less than the 60/40 benchmark.

Data Dump:

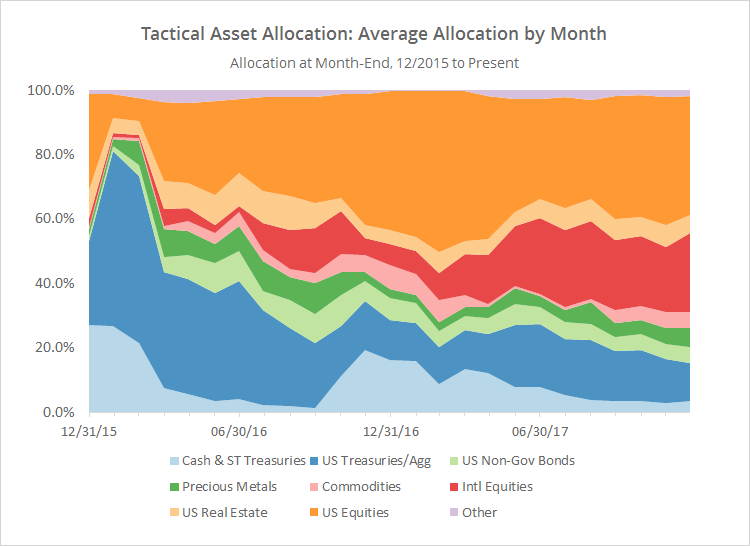
With such a large pool of published strategies to draw on (40 and counting), we’re able to draw some broad conclusions about the state of TAA. The following two charts help to show trends in the asset classes that TAA as a whole is allocating to over time. Members note that you can see this information updated daily with our Aggregate Asset Allocation report.

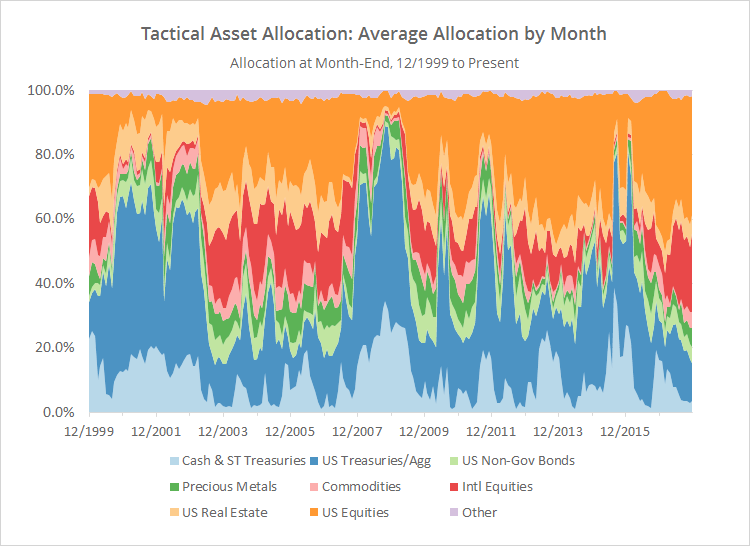
The first chart shows the average month-end allocation to categories of assets by all of the strategies that we track. For example, “US Equities” may include everything from the S&P 500 to individual stock market sectors. The important takeaways from this chart are essentially the same as they were for most of the year: TAA’s exposure to defensive assets like cash (light blue) and US Treasuries (dark blue) is at it’s lowest point since 2004, and exposure to international equities (red) is near it’s highest point since late 2005 (click for a longer view). TAA continues to be positioned very aggressively. That will become even clearer in the follow up charts.


(click for a longer view)

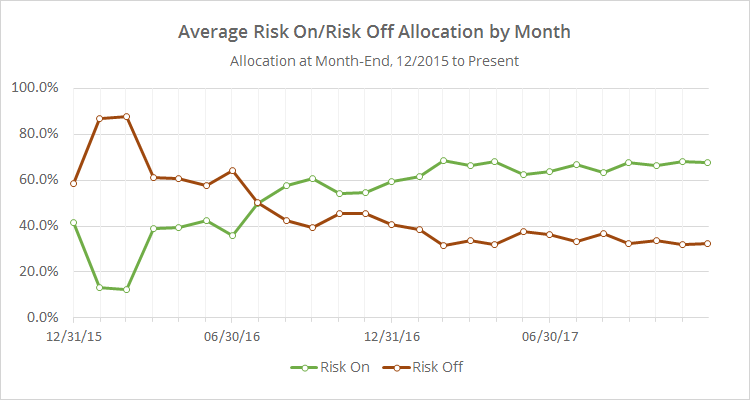
In the second chart below, we’ve combined average TAA allocation into even broader categories: “risk on” (equities, real estate and high yield bonds) versus “risk off” (everything else). We realize that some asset classes don’t fit neatly into these buckets, but it makes for a useful high level view.

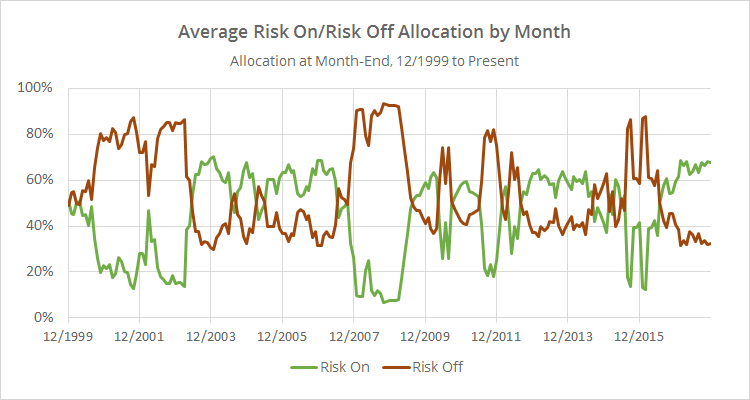
This chart shows that overall allocation to risk assets remains elevated. The last time TAA’s exposure to risk assets stood at these levels was way back in 2007, about 6 months prior to the onset of the Global Financial Crisis (click for a longer view). That’s a good thing if this broad rally continues, but it means that there remains significant exposure to investors here if the market stumbles in January.


(click for a longer view)

We invite you to become a member for about a $1 a day, or take our platform for a test drive with a free limited membership. Put the industry’s best tactical asset allocation strategies to the test, combine them into your own custom portfolio, and then track them in near real-time. Have questions? Learn more about what we do, check out our FAQs or contact us.

Filed Under: TAA Performance

Previous Post
Next Post

Primary Sidebar

About Us

We have built a platform to track the industry's best Tactical Asset Allocation strategies in near real-time, and combine them into custom portfolios.

Learn about what we do or take our platform for a free test drive.

Follow Our Blog

Recent Posts

  • Front-Running Seasonality in Country ETFs: An Extended Test
  • New Feature: Walked-Forward Optimal Strategy Combinations (aka “Meta Walk-Forwards”)
  • Walking Forward Optimal Strategy Combinations
  • Taming Excessive “Timing Luck” in TAA by Tranching Strategies
  • Piard’s Annual Seasonality

Categories

Footer

About Us

We have built a platform to track the industry's best Tactical Asset Allocation strategies in near real-time, and combine them into custom portfolios.

Learn about what we do and take our platform for a free test drive.

New from Our Blog

  • Front-Running Seasonality in Country ETFs: An Extended Test April 29, 2025
  • New Feature: Walked-Forward Optimal Strategy Combinations (aka “Meta Walk-Forwards”) April 22, 2025
  • Walking Forward Optimal Strategy Combinations March 31, 2025

Helpful Links

  • What We Do
  • List of Strategies
  • Advanced Features
  • Subscribe
  • Blog
  • FAQs
  • Contact Us
  • Member Login

Stay Informed

Follow the latest research from our blog via Twitter, RSS and email:

© 2025 Allocate Smartly. All rights reserved.
  • Affiliates
  • Terms of Service
  • Privacy