• Skip to primary navigation
  • Skip to main content
  • Skip to primary sidebar
  • Skip to footer

Allocate Smartly

  • About
    • What We Do
    • List of Strategies
    • Advanced Features
    • FAQs
    • Contact Us
  • Subscribe
  • Blog
  • Members

Tactical Asset Allocation in June

July 2, 2019

This is a summary of the recent performance of a wide range of excellent Tactical Asset Allocation (TAA) strategies, net of transaction costs. These strategies are sourced from books, academic papers, and other publications. While we don’t (yet) include every published TAA model, these strategies are broadly representative of the TAA space. Learn more about what we do or let AllocateSmartly help you follow these strategies in near real-time.

Recent Performance of Asset Allocation Strategies
Use the Arrows to Sort This Table
Strategy Jun YTD
Philosophical Economics’ Growth-Trend Timing 6.96% 14.59%
Traditional Dual Momentum 6.96% 6.74%
Davis’ Three Way Model 5.30% 7.65%
60/40 Benchmark 4.66% 13.77%
Varadi’s Minimum Correlation Portfolio 4.58% 10.66%
PortfolioCharts’ Golden Butterfly 4.50% 10.82%
Stoken’s Active Combined Asset 4.49% 12.60%
Tactical Permanent Portfolio 4.11% 6.61%
Browne’s Permanent Portfolio 4.03% 9.96%
Faber’s Ivy Portfolio 3.91% 13.39%
Dalio’s All-Weather Portfolio 3.55% 12.07%
Newfound’s Diversified Dual Momentum 3.49% 3.03%
Faber’s Trinity Portfolio Lite 3.49% 8.64%
US Min Correlation 3.29% 12.37%
Composite Dual Momentum 3.13% 7.57%
Stoken’s Active Combined Asset – Monthly 3.08% 10.66%
Livingston’s Mama Bear Portfolio 3.08% 6.43%
Faber’s Global Tactical Asset Alloc. – Agg. 6 3.00% 5.17%
US Equal Risk Contribution 2.98% 11.71%
US Max Diversification 2.97% 10.34%
US Max Sharpe 2.90% 10.39%
Varadi’s Percentile Channels 2.81% 5.24%
Novell’s Tactical Bond Strategy 2.57% 6.79%
Allocate Smartly’s Meta Strategy 2.51% 5.49%
Efficiente Index 2.27% 2.69%
Faber’s Global Tactical Asset Alloc. 13 2.20% 3.71%
Livingston’s Papa Bear Portfolio 1.78% 0.63%
Faber’s Global Tactical Asset Alloc. – Agg. 3 1.71% 0.50%
Protective Asset Allocation – CPR 1.57% 4.25%
Protective Asset Allocation 1.57% 4.25%
Robust Asset Allocation – Aggressive 1.49% 1.31%
Global Risk Parity Trend Following 1.39% 2.22%
Defensive Asset Allocation 1.36% 1.29%
Robust Asset Allocation – Balanced 1.23% 2.98%
Adaptive Asset Allocation 1.21% 2.67%
Elastic Asset Allocation – Defensive 1.19% 3.01%
Elastic Asset Allocation – Offensive 1.17% 0.82%
Classical Asset Allocation – Defensive 1.16% 4.68%
Classical Asset Allocation – Offensive 1.09% 1.88%
Kipnis’ Defensive Adaptive Asset Allocation 1.09% -3.76%
Keuning’s Generalized Protective Momentum 1.01% 6.06%
Vigilant Asset Allocation – Balanced 1.01% 1.18%
Vigilant Asset Allocation – Aggressive 1.01% -0.38%
Glenn’s Paired Switching Strategy 0.95% 2.41%
Flexible Asset Allocation 0.94% -0.38%
US Risk Parity Trend Following 0.85% 3.49%
Accelerating Dual Momentum 0.75% 3.17%
Faber’s Global Tactical Asset Alloc. 5 0.62% 2.45%
Faber’s Sector Relative Strength 0.07% -0.10%

Commentary:

Tactical Asset Allocation turned in what would normally be considered solid numbers for the month, but still underperformed its benchmark…badly. TAA entered June positioned defensively in response to market weakness in May. That proved to be overly-cautious, as equities recovered sharply (ex. SPY +7.0%, EFA +5.9%, EEM +6.2%).

As we show in the data dump below, TAA (in aggregate) is back to a more balanced asset allocation with roughly equal exposure to risk and defensive assets.

This is the second time this year that TAA has been “head faked” by short-term market weakness like this, and it shows in the YTD numbers. To some degree, this is the price of doing business for trend-following/momentum types of strategies. At some point, TAA’s cautious nature is going to save the portfolio from significant loss (ex. 2000-02 and 2007-08), but in the meantime, that risk adversity makes TAA prone to getting stuck on the sidelines when those losses don’t develop.

Data Dump:

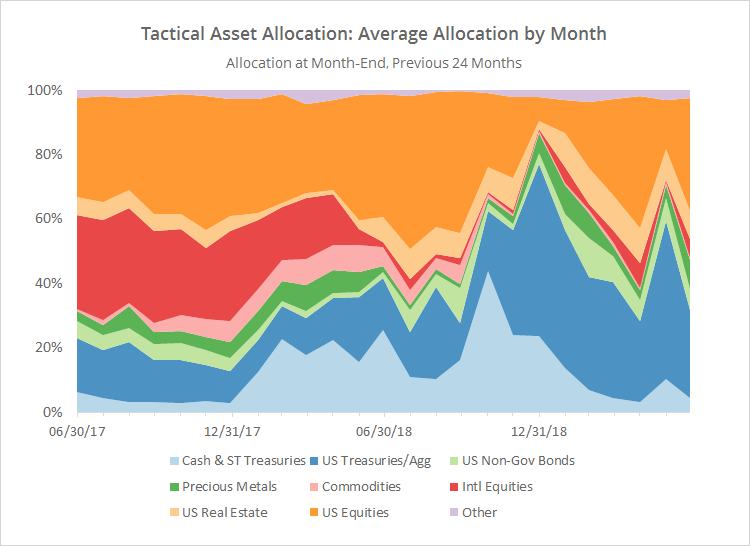
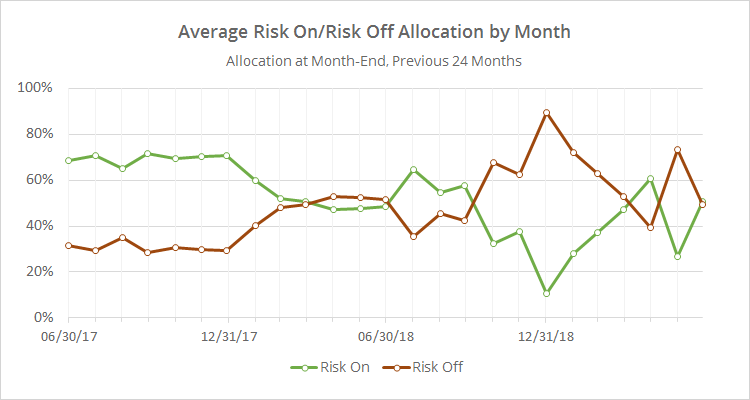
With such a large pool of published strategies to draw on (49 and counting), we’re able to draw some broad conclusions about the state of TAA. The following two charts help to show trends in the asset classes that TAA as a whole is allocating to over time.

The first chart shows the average month-end allocation to categories of assets by all of the strategies that we track. For example, “US Equities” may include everything from the S&P 500 to individual stock market sectors. Defensive assets tend to be at the bottom of the chart, and offensive at the top. The data on the far right of the chart reflects where TAA stood as of the end of the most recent month.

The biggest shift in allocation was out of US Treasuries (-22%) and into US Equities (+20%).


(click for a longer view)

In the second chart below, we’ve combined average TAA allocation into even broader categories: “risk on” (equities, real estate and high yield bonds) versus “risk off” (everything else). We realize that some asset classes don’t fit neatly into these buckets, but it makes for a useful high level view.

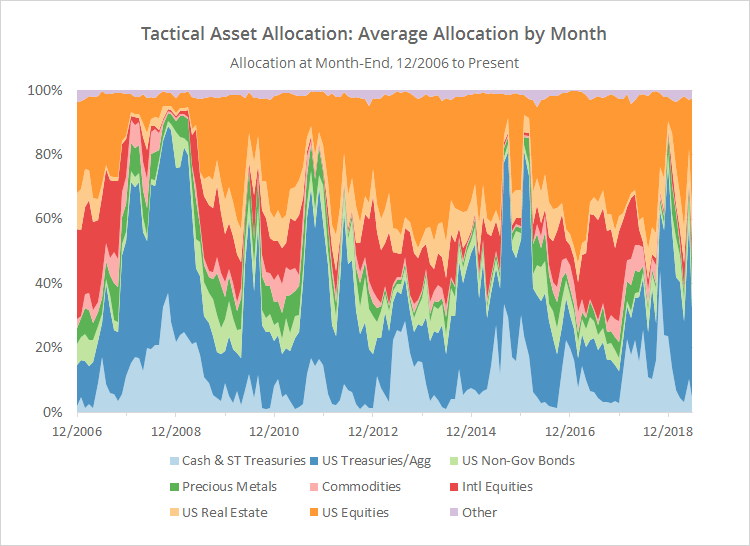
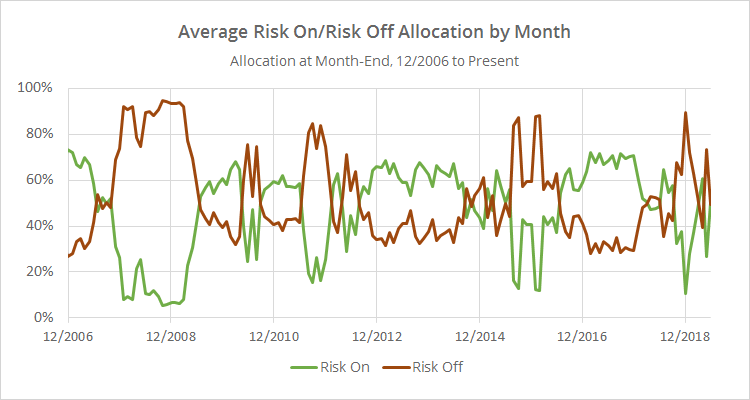
Note the significant increase in exposure to defensive assets, and subsequent reversal to a more moderate allocation (click for a longer view).


(click for a longer view)

We invite you to become a member for about a $1 a day, or take our platform for a test drive with a free limited membership. Put the industry’s best tactical asset allocation strategies to the test, combine them into your own custom portfolio, and then track them in near real-time. Have questions? Learn more about what we do, check out our FAQs or contact us.

Filed Under: TAA Performance

Previous Post
Next Post

Primary Sidebar

About Us

We have built a platform to track the industry's best Tactical Asset Allocation strategies in near real-time, and combine them into custom portfolios.

Learn about what we do or take our platform for a free test drive.

Follow Our Blog

Recent Posts

  • Hybrid Asset Allocation
  • Zakamulin’s Optimal Trend Following
  • A Note About Commodities and How We Represent Them on Our Platform
  • The Best Defensive Asset Class
  • Cross-Asset Signals and Time Series Momentum

Categories

Buy & Hold More Your Speed?

Check out our sister site dedicated to building better buy & hold portfolios:

BetterBuyAndHold.com.

Footer

About Us

We have built a platform to track the industry's best Tactical Asset Allocation strategies in near real-time, and combine them into custom portfolios.

Learn about what we do and take our platform for a free test drive.

New from Our Blog

  • Hybrid Asset Allocation March 3, 2023
  • Zakamulin’s Optimal Trend Following December 19, 2022
  • A Note About Commodities and How We Represent Them on Our Platform December 6, 2022

Helpful Links

  • What We Do
  • List of Strategies
  • Advanced Features
  • Subscribe
  • Blog
  • FAQs
  • Contact Us
  • Member Login

Stay Informed

Follow the latest research from our blog via Twitter, RSS and email:

© 2023 Allocate Smartly. All rights reserved.
  • Affiliates
  • Terms of Service
  • Privacy