This is a summary of the recent performance of a number of excellent tactical asset allocation strategies. These strategies are sourced from books, academic papers, and other publications. While we don’t (yet) include every published TAA model, these strategies are broadly representative of the TAA space. Read more about our backtests or let AllocateSmartly help you follow these strategies in near real-time.
| Recent Performance of Asset Allocation Strategies Use the Arrows to Sort this Table |
||
|---|---|---|
| Strategy | Sep | YTD |
| Elastic Asset Allocation – Offensive | 1.37% | 2.54% |
| Elastic Asset Allocation – Defensive | 1.07% | 4.96% |
| Faber’s Global Tactical Asset Alloc. 5 | 0.81% | 3.89% |
| Faber’s Ivy Portfolio | 0.78% | 8.36% |
| Faber’s Global Tactical Asset Alloc. 13 | 0.56% | 7.20% |
| Protective Asset Allocation | 0.49% | 8.15% |
| Gray’s Robust Asset Allocation – Aggressive | 0.47% | 2.88% |
| Gray’s Robust Asset Allocation – Balanced | 0.33% | 2.78% |
| Faber’s Sector Relative Strength | 0.31% | -4.54% |
| Flexible Asset Allocation | 0.23% | 2.47% |
| 60/40 Benchmark | 0.10% | 7.69% |
| Traditional Dual Momentum | 0.01% | 2.41% |
| Varadi’s Minimum Correlation Portfolio | -0.18% | 16.09% |
| Browne’s Permanent Portfolio | -0.20% | 11.90% |
| Dalio’s All-Weather Portfolio | -0.23% | 12.44% |
| Davis’ Three Way Model | -0.27% | 4.28% |
| Varadi’s Percentile Channels | -0.30% | 5.14% |
| Adaptive Asset Allocation | -0.44% | 6.00% |
| Glenn’s Paired Switching Strategy | -1.71% | -2.10% |
Commentary:
A number of strategies posted solid numbers for the month on the back of strong performance in key non-US equity/Treasury asset classes, notably commodities (as represented by DBC, +4.3%), emerging markets (EEM, +2.5%), and Japan equities (EWJ, +2.1%).
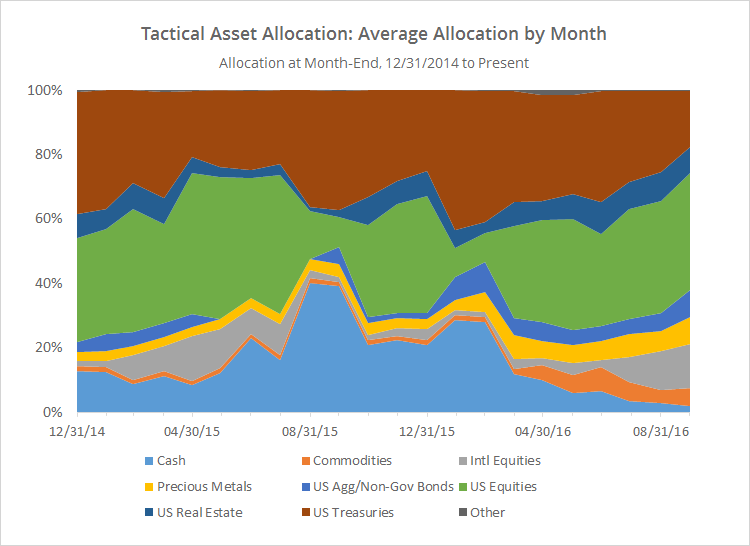
The big story at the moment though is the continuing decline in allocation to defensive assets. The chart below shows the average allocation to broad categories of assets by the 19 TAA strategies that we track, as of the end of each month since EO’2014. Note how allocation to US Treasuries (red) and cash (light blue) are now at sample lows.
While some of that decline has been picked up by other potentially defensive assets, such as precious metals and commodities, I think it’s fair to say that these TAA strategies as a whole are clearly in risk-on mode. As previously mentioned, while we don’t (yet) track every published tactical asset allocation model, the 19 strategies that we do track are broadly representative of the TAA space, and I think it’s fair to draw some broader conclusions from this data.
Coming soon:
A number of readers have asked us to add the aggressive versions (Agg 3 and Agg 6) of Meb Faber’s GTAA strategy from his seminal paper A Quantitative Approach to Tactical Asset Allocation. Expect to see that in the next couple of days.
