Tactical Asset Allocation (TAA) weathered the storm in March well, significantly paring down losses versus conventional buy & hold.
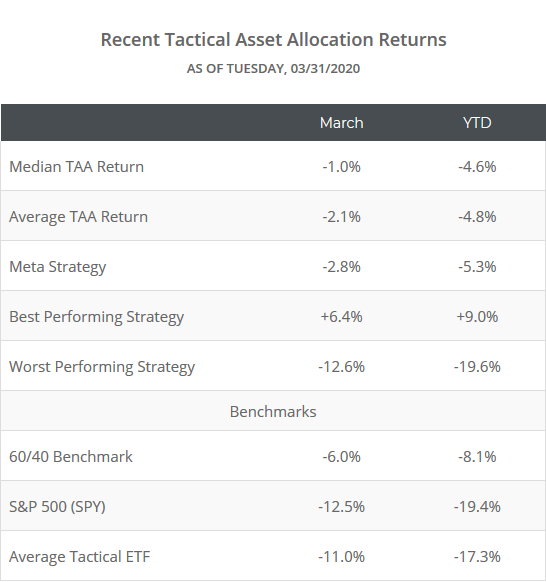
We track 50+ TAA strategies sourced from books, papers, etc., allowing us to draw some broad conclusions about TAA as a style. In the table below we show the March and YTD returns of these 50+ strategies:
20 out of 54 strategies were up for the month, and 16 up year to date. TAA is designed to earn its keep in times like we find ourselves in now, by knowing when to reduce exposure to risk in order to protect the portfolio. So far it’s done that. We’re in the early days of this crisis though, and we’ll only be able to judge TAA’s success or failure over a full cycle. We highly recommend reading the rest of this note to understand what to expect from TAA in the coming month(s).
This is a hero or zero moment:
The average TAA strategy is now 86% allocated to defensive assets like Treasuries and gold.
We view portfolio allocation as being on a spectrum, alternating between either moderately risky or moderately defensive postures, but rarely reaching extremes. There are usually too many unknowns at any given time to take an overly bold position either way.
This is one of those rare times however where TAA has reached an extreme. If it weren’t for a handful of stragglers, TAA would be all in on risk off. That’s great if this market continues to melt down, but it exposes TAA to significant risk if the market bounces from here.
This is a hero or zero moment. So far, TAA has been the hero. If we bounce many months from now, TAA will likely miss the bottom, but that’s fine. It’s the price of admission for trend-following/momentum oriented strategies. We would have prevented a lot of losses along the way; we’ll adjust and ride the recovery. If we bounce tomorrow however, any losses prevented in February and March may get washed out. My gut tells me a rally doesn’t happen for anything other than a fleeting moment in April, but the risk is there.
Data dump:
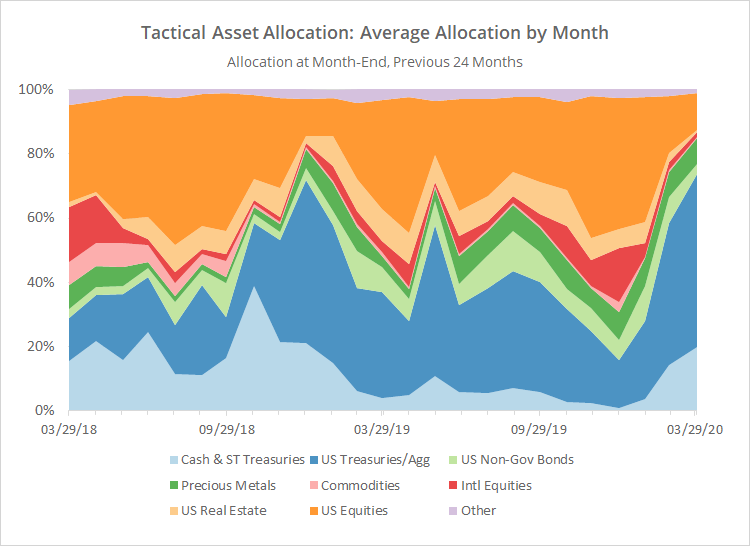
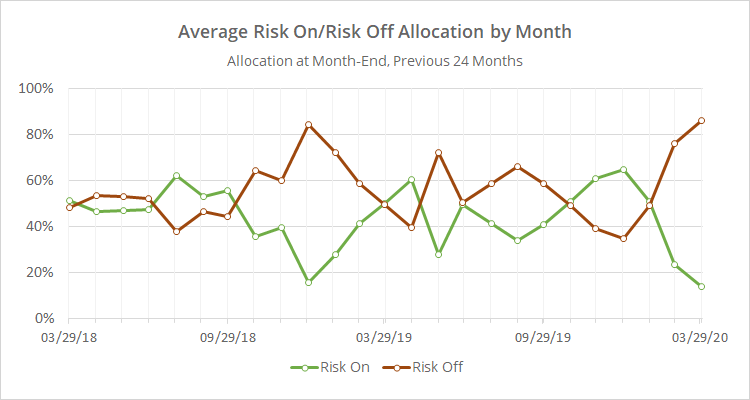
The following two charts help to show trends in the asset classes that TAA is allocating to over time.
The first chart shows the average month-end allocation to categories of assets. For example, “US Equities” may include everything from the S&P 500 to individual stock market sectors. Defensive assets tend to be at the bottom of the chart, and offensive at the top. The data on the far right of the chart shows where TAA stood as of the end of March.
In the second chart below, we’ve combined average TAA allocation into even broader categories: “risk on” (equities, real estate and high yield bonds) versus “risk off” (everything else). We realize that some asset classes don’t fit neatly into these buckets, but it makes for a useful high level view.
Note the shift out of risk assets beginning in February. We were at roughly this same point following the market pullback in late 2018. That time the market quickly rebounded, and any losses prevented when the market dropped, were washed out in the subsequent recovery. TAA got headfaked. This time is obviously a more significant moment for both the economy and the market.
Other observations:
Not all strategies are created equal:
While TAA as a whole did well, there was a wide disparity in results. That should be clear comparing the best and worst strategies in the table above. There were a few dogs. Of course, knowing which strategy will be the next dog is hard. It’s easy to separate the best and worst strategies at the extremes, but knowing which of two good options is better might not be possible.
That highlights the importance of diversifying across multiple strategies, something our platform is specifically designed to do. Going all in on a single strategy could have been devastating.
A note on Tactical ETFs:
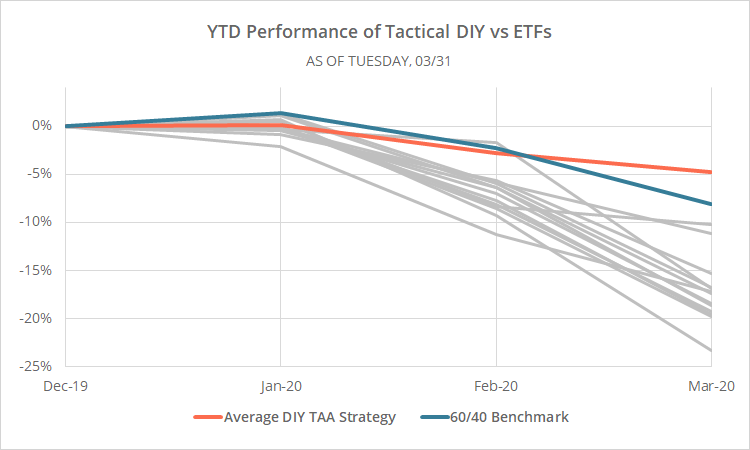
These results only apply to DIY tactical asset allocation (i.e. the types of strategies we track). Tactical ETFs have been mostly terrible. We speculated why here. Below we’ve plotted the average DIY strategy we track in orange, versus the 60/40 benchmark in blue and 13 tactical ETFs in grey.
We’re not dancing on anyone’s grave here. Far from it. We’re in the business of TAA. From a practical perspective, we want to be better than those ETF solutions (b/c otherwise, what’s our purpose), but if there’s a false perception that TAA as a style has failed, it’s almost certainly a bad thing for us. TAA as a whole did fine. Individual strategies varied widely.
A note on Meta Strategy:
Our own Meta Strategy outperformed all of the Tactical ETFs above, but underperformed the average strategy on our site (see table #1). That’s disappointing. We discussed why here. In response, we’ve set some common sense limits on how “non-tactical” Meta will be allowed to become in the future. At the moment, Meta is a bit more defensive than the average strategy on our site.
A personal note:
It feels a little icky writing about dollars and cents during a very human crisis like this, but it’s our lane. We hope that by helping investors to have a concrete plan of attack, we can at least take that stress off the table for them.
As discussed here, the two main brains at Allocate Smartly are currently holed up in Taiwan (very good) and near NYC (very bad). As long as one of us is up and running (along with our hosting provider and at least one of our redundant data providers), this site will function as expected. We will be here to provide whatever help we can through this.
If you have questions or comments or just want to have a chat regarding just about anything quant finance, please don’t hesitate to reach out. Stay safe out there folks.
New here?
We invite you to become a member for about a $1 a day, or take our platform for a test drive with a free limited membership. Put the industry’s best tactical asset allocation strategies to the test, combine them into your own custom portfolio, and follow them in near real-time. Not a DIY investor? There’s also a managed solution. Learn more about what we do.


