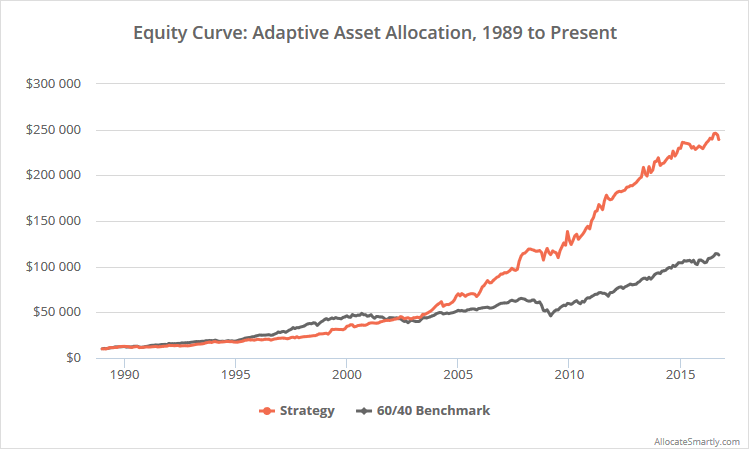
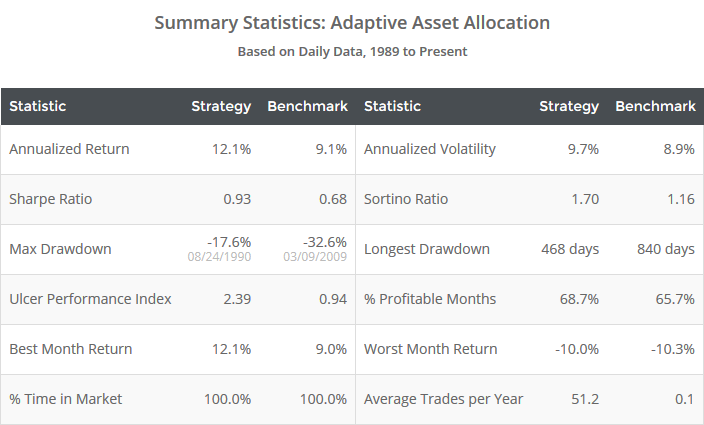
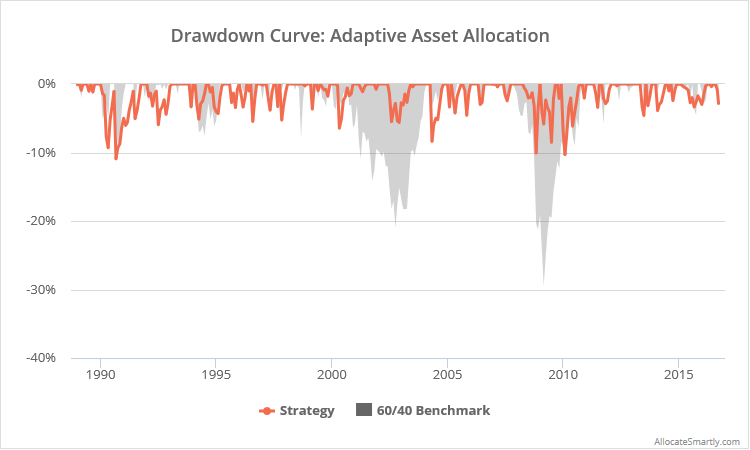
This is a test of a tactical asset allocation strategy from the team at GestaltU and ReSolve Asset Management as described in the paper: Adaptive Asset Allocation: A Primer. The model combines momentum with a minimum variance portfolio to trade a diverse array of global asset classes. The paper is a particularly accessible treatment of issues with traditional portfolio theory, and the effectiveness of combining asset class momentum with a smarter approach to portfolio allocation. Results from 1989 follow, after which we discuss strategy rules.
Read more about our backtests or let AllocateSmartly help you follow this strategy in near real-time.

Linearly-scaled. Click for a logarithmically-scaled chart.
Note that complete strategy rules are not precisely stated in the paper. The rules tested below are the result of working with the paper’s authors.
Strategy rules tested:
- At the close on the last trading day of the month, calculate the 6-month (126-day) return for each of the following 10 asset classes: US equities (represented by SPY), European equities (EZU), Japanese equities (EWJ), emerging market equities (EEM), US REITs (VNQ), international REITs (RWX), US 10-year Treasuries (IEF), US 30-year Treasuries (TLT), commodities (DBC) and gold (GLD).
- Go long at the close the five assets (i.e. half of the portfolio) with the highest 6-month return. Weight the five assets according to minimum variance optimization, using a “weighted” covariance matrix calculated based on 126-day correlation and 20-day volatility.
- Hold positions until the final trading day of the following month. Rebalance the entire portfolio monthly, regardless of whether there is a change in position.
See end notes for more nuanced details about this backtest.
A smarter approach to portfolio weighting:
This paper uses a simple measure of momentum to know what to trade, but uses minimum variance optimization to know how much of each asset to trade. I am a big proponent of volatility/correlation-based weighting schemes like this (for another example, see Varadi’s Minimum Correlation), as volatility and correlation are often more predictable than returns. While these approaches often provide little benefit in terms of total return (i.e. terminal wealth), they tend to greatly improve return relative to risk.
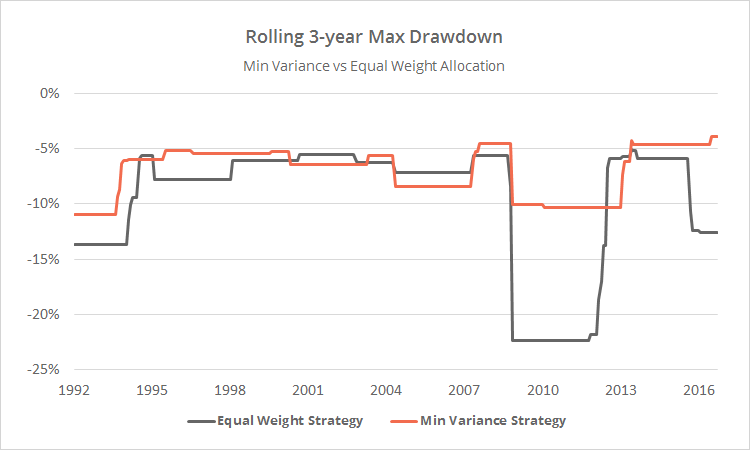
To illustrate, below I’ve shown the rolling 3-year max drawdown (month-end) for the strategy in orange, versus an equally-weighted version of the strategy in grey. Both have exhibited similar returns (12.1% annualized vs 12.4% for equal-weight), but note how the min variance approach has done a much better job managing the worst historical drawdowns.
Why is that important?
It’s easy to look at a very long backtest and be swayed by big returns. It’s a very different thing to actually “feel” those returns month in and month out. When trading a portfolio in real-time, volatility and drawdowns matter…a lot. Minimizing these, using techniques like minimum variance, means that investors’ are more likely to stay the course when strategies inevitably go through a rough patch (like many asset class momentum strategies find themselves in right now).
End notes:
- Results do not include international real estate exposure (RWX) prior to mid-1999 due to a lack of accurate asset data. During this period, we’ve reduced the number of assets traded from 5 to 4 (to maintain the author’s “top half” approach to relative momentum). This adjustment improved performance over the pre-RWX period.
- The minimum variance portfolio will sometimes call for an extremely small allocation to a given asset. We’ve ignored any position smaller than 2% of the portfolio, and reallocated that position to other assets (proportionally). This change is necessary because we assume that members are including the strategy as just one component of their custom model portfolio, meaning a position size of less than 2% could become impractically small. This change had a negligible positive impact on performance.
For additional information about this strategy, we recommend the following sources. Note that our results are often more pessimistic than you’ll find elsewhere because of stricter backtest assumptions:


