Allocate Smartly just got even better, with three awesome new features to help members make better Tactical Asset Allocation (TAA) decisions:
- Multiple Custom Model Portfolios + Dashboard
- Portfolio Tranching
- Aggregate Asset Allocation Report
Multiple Custom Model Portfolios
A key component of our members area is what we call “custom model portfolios”. What is a model portfolio? It’s just like any other portfolio, but rather than selecting assets to trade, the member selects TAA strategies and how much to allocate to each. Members can backtest how the combined portfolio would have performed historically, and then follow the portfolio in near real-time.
Previously, each member was only allowed one model portfolio, but there are all kind of reasons why a member would require more. Portfolios designed for taxable versus nontaxable accounts, portfolios designed to be conservative versus aggressive, etc.
We’ve now given members up to three model portfolios and added a new Dashboard to help conveniently manage them all simultaneously. Members: check out your new Dashboard now.
Portfolio Tranching
Most published TAA research assumes that strategies trade monthly on the last trading day. That’s because (a) monthly asset class data is usually available much farther back into history than daily data, allowing for longer backtests, and (b) TAA is by its nature designed to ignore day-to-day noise, so trading too often is often counterproductive.
We’ve talked a lot on this site about the importance of understanding how a strategy would have performed trading on other days of the month as well (and we provide those statistics in our members area). One of the things that this type of analysis can help to suss out is the degree of “timing luck” that exists in a conventional end-of-month backtest. Here’s a great article from Newfound Research [dead link] on the subject.
To illustrate, the following graph shows the results of trading our newest strategy, Vigilant Asset Allocation from Dr. Keller and JW Keuning, on the last day of the month as designed (orange) versus other days of the month (grey). Note the wide disparity in results.
To help better manage timing luck, we’ve now given members the ability to “tranche” their custom model portfolios. Rather than trading a strategy on day X, members can now choose to split the strategy across multiple days of the month to minimize the luck (good or bad) of trading the entire strategy on just one day.
Aggregate Asset Allocation Report
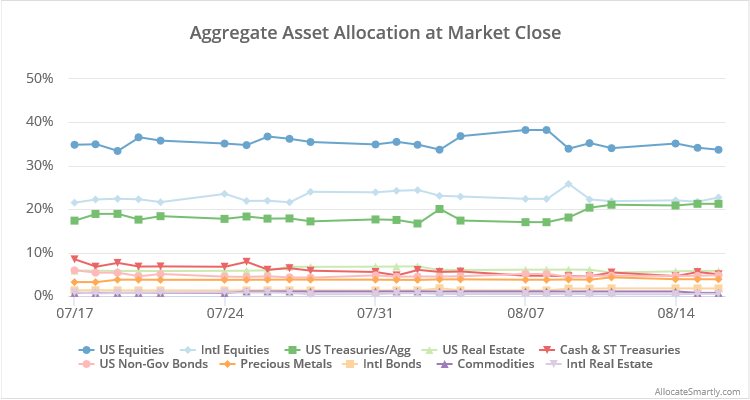
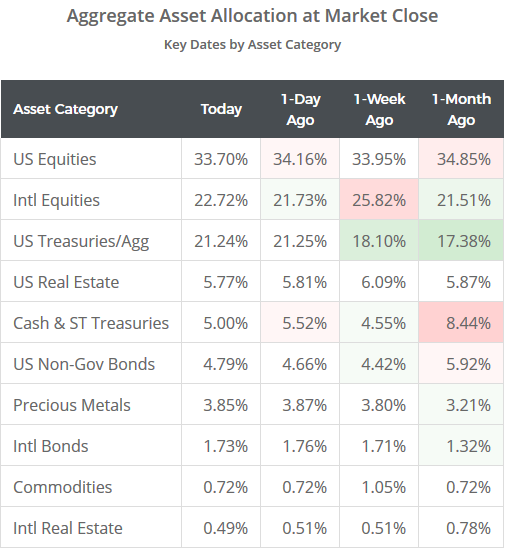
We’ve added a new report showing the aggregate asset allocation of the 30+ TAA strategies that we track, and how it has changed over the previous month. The report is updated daily in three flavors: by individual asset (ex. SPY), by asset category (ex. US Equities) and by risk on versus risk off. Members: check out the new Aggregate Asset Allocation report now.
This new report is not intended to be followed in real-time (your custom model portfolios do a better job of that, and allow for a much higher degree of customization). This report is intended to provide color and insight into how TAA as a whole is reacting to this market.
We’ve shown a sample below of the current asset category report. Note that this is a simplified, static version; the actual report is interactive. The relative calm over the last month means that there hasn’t been much movement in aggregate asset allocation over this period, but this chart will look very different when the next crisis (inevitably) arrives.
A special thanks to our members for all of the valuable feedback that guided these changes. We’ve knocked some biggies off the todo list, but there’s still a ton more we’d like to tackle in the coming months and years. As always, please keep your suggestions, comments and questions coming.


