We delayed adding the latest strategy to our site (GestaltU’s Adaptive Asset Allocation) for a week due to technical hurdles running the minimum variance component of the strategy in near real-time for members. Historical results on GestaltU’s strategy are exceptional though, and we plan to have the challenges with real-time worked out shortly.
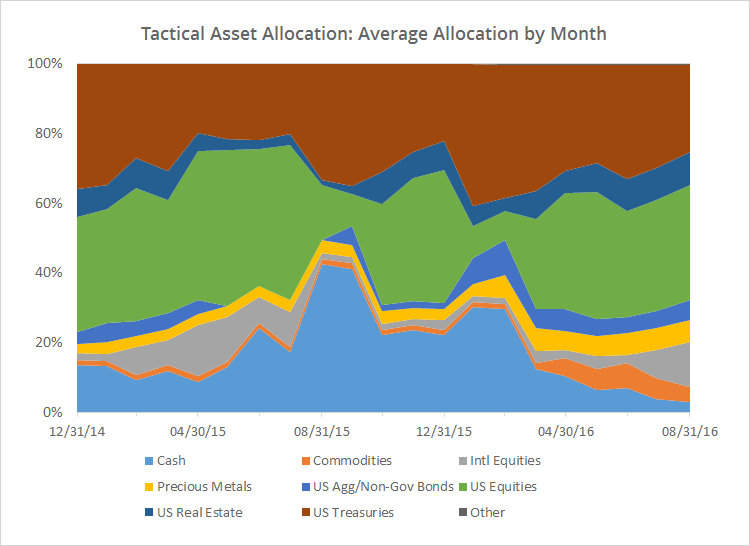
In the meantime, I thought the following chart interesting and worthy of sharing. This chart shows the average allocation for the 18 tactical asset allocation strategies that we track, as of the end of each month since EOY 2014.
We grouped asset classes into broad categories, so for example, “US Equities” includes ETFs ranging from SPY (S&P 500) and IWM (Russell 2000), to 10 individual sector funds. Figures reflect the allocation in place at the end of each month, so investors effectively “felt” that allocation in the month that followed.
Entering into September, these 18 strategies were clearly in risk-on mode. Allocation to US Treasuries and cash were at or near lows seen since EOY 2014. Allocation to other categories was in-line with sample norms, with the exception of an uptick in international equities over the last two months, and a strong showing from commodities for much of this year.
A more general takeaway from this chart is just how US-centric most of these strategies are, with total average allocation to US-focused assets ranging from 50-80%. The strategies that we track are broadly representative of the tactical asset allocation space, so that observation is a reflection of work that’s been published on TAA, rather than a reflection of the particular strategies that we cover. I think that there might be an opportunity for TAA to expand here.
AllocateSmartly
