New to Tactical Asset Allocation? Learn more: What is TAA?
The Two Centuries Investments blog from Mikhail Samonov has become a new favorite of mine. More “thought heavy” than “numbers heavy”, Mikhail is a fount of novel ideas. In this piece he describes something I apply in my own investing (though never defined so succinctly): the need to balance strategy risk and asset risk.
I encourage you to read Mikhail’s piece, but in short, different approaches to trading are exposed to varying degrees of either strategy risk or asset risk. Strategy risk is the risk originating from the strategy itself (think “momentum trading” for example), while asset risk is the risk from the underlying assets held (buy & hold is mostly asset risk).

Source: Two Centuries Investments
Risk is not in and of itself a bad thing. Without risk there is no reward. Mikhail makes the case however that it’s important to balance these two risks in the portfolio. Why? Because investors have a pesky habit of changing their approach to investing after a period of significant underperformance in either, usually at the worst possible time. Balancing the two risks encourages investors to stick with a smart investment plan, instead of perpetually chasing the last hot thing.
In the case of tactical asset allocation, strategy risk has paid off handsomely during ugly markets like 2000-02 and 2007-08, with most strategies that we track sidestepping the worst of the fallout. During go-go bullish periods like we’ve seen this year, strategy risk has been a detriment, with any position other than long asset risk to the gills being suboptimal.
No one (and by “no one” I mean no one) can predict long-term market direction. That being the case, balancing strategy and asset risk helps investors to stay the course both when strategy risk (ex. 2007-08) and when asset risk (right now) reigns supreme.
Measuring strategy vs asset risk:
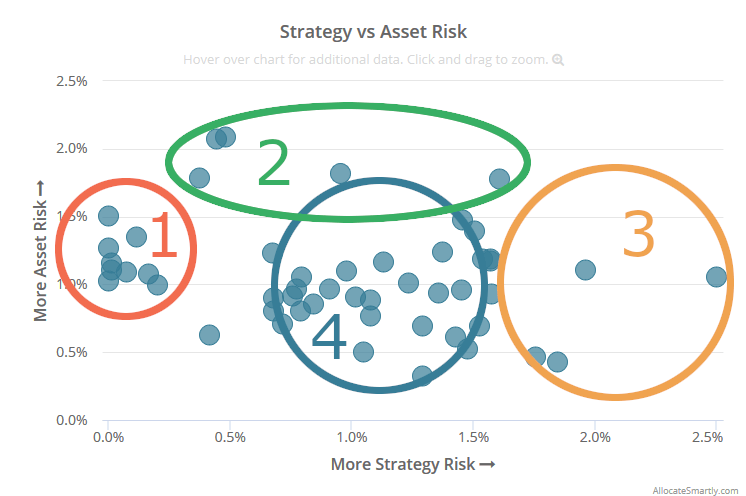
In the graph below we’ve taken a shot at producing an unbiased measurement of strategy risk (x-axis) vs asset risk (y-axis) for each of the strategy’s that we track. We’ll talk about how we derived these numbers in a moment, but first let’s look at the results.
Hover over each dot to see the strategy name. Important: This chart is dynamic and requires javascript, so if you’re reading this on RSS or email you’ll need to click through to this post to see these results.
There are four “regions” of note that we’ve highlighted in the image below.
- Moderate asset risk, low strategy risk (ORANGE): These are low turnover strategies primarily driven by risk in the underlying assets. Many of these strategies are doing well this year. Asset risk is moderated by the fact that they tend to be reasonably diversified. Example strategy: Equal Risk Contribution.
- High asset risk (GREEN): These are dynamic strategies, where most asset exposure is from a similar asset category driven by similar macro factors (ex. all equities, or all bonds). Example strategy: Novell’s Tactical Bond.
- High strategy risk (YELLOW): These are hyperactive strategies that tend to take very concentrated positions. These are boom or bust approaches to asset allocation. Example strategy: Vigilant Asset Allocation.
- Moderate asset risk, moderate strategy risk (BLUE): These are dynamic strategies that tend to take more diversified, less hyperactive positions. Lots of examples here.
How to use these results:
This is not intended as a judgement about the efficacy of any given strategy. A strategy that is high in asset or strategy risk is not necessarily good or bad, it simply means returns are primarily driven by the success of either the asset(s) or the strategy itself.
What it is intended to show however are underlying risks that should be understood, and we believe balanced. Taking on too much of one risk or the other will encourage investors to make poor decisions when that flavor of risk is out of fashion.
That doesn’t necessarily mean only choosing balanced strategies. It could also mean combining the right strategies. A key feature of our platform is the ability to combine multiple individual strategies together into what we call “custom model portfolios” (learn more).
Just like diversifying across assets controls asset risk, diversifying across strategies controls strategy risk. So, for example, while it may not make sense to trade an entire portfolio with an extreme strategy like Vigilant Asset Allocation (the dot on the far right of the chart), it may make sense when VAA is just one component of a broader portfolio and its purpose is to ramp up strategy risk.
For the nerds: How we created these results:
For asset risk, we calculated the monthly tracking error of the strategy’s average lifetime asset allocation, versus the aggregate average lifetime asset allocation across all strategies that we track. We would have liked to use something like the Global Market Portfolio as our baseline here, but it’s not possible to accurately estimate GMP monthly returns so far into the past, so the aggregate average serves as our stand in for the GMP.
For strategy risk, we calculated the monthly tracking error of the strategy’s backtested returns, versus the aggregate average lifetime asset allocation across all strategies, minus the asset risk calculated above. The same comment re: the GMP applies here as well.
We read (and agree) with what Mikhail wrote about there being “hidden” strategy/asset risk not necessarily captured by tracking error, but we needed an unbiased metric we could apply uniformly. Consider this is a broad, back of the envelope analysis, and not an intense drilldown on any particular strategy.
New here?
We invite you to become a member for about a $1 a day, or take our platform for a test drive with a free limited membership. Put the industry’s best tactical asset allocation strategies to the test, combine them into your own custom portfolio, and then track them in near real-time. Have questions? Learn more about what we do, check out our FAQs or contact us.

