This is a test of Thomas Carlson’s “Defense First” strategy from his paper Defense First: A Multi-Asset Tactical Model for Adaptive Downside Protection.
Strategy results from 1971 follow. Results are net of transaction costs – see backtest assumptions. Learn about what we do and follow 90+ asset allocation strategies like this one in near real-time.
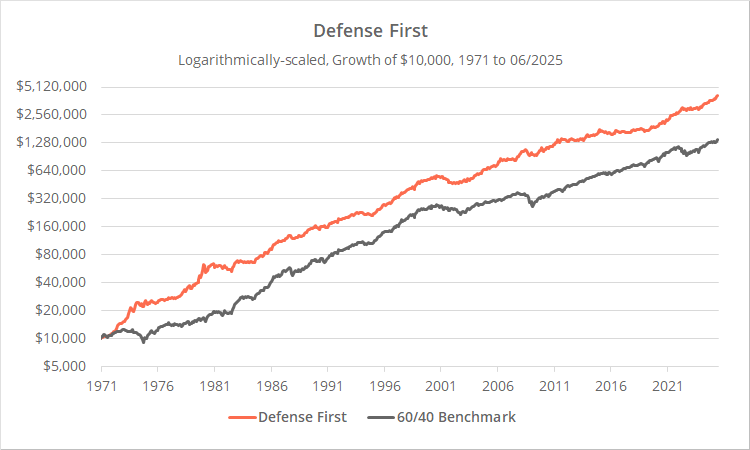
Logarithmically-scaled. Click for linearly-scaled results.
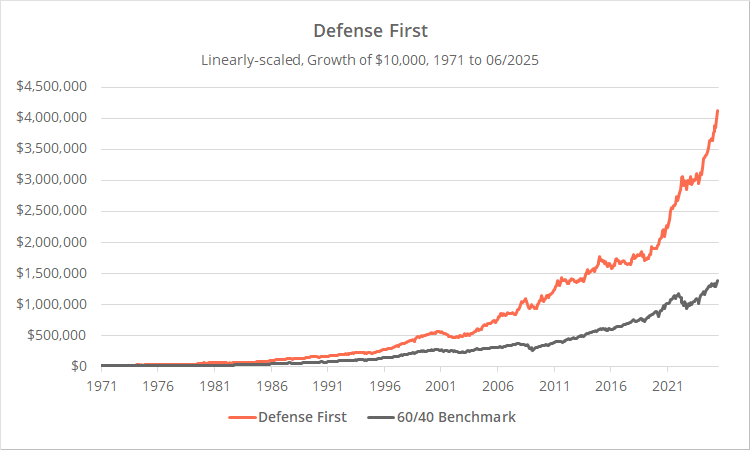
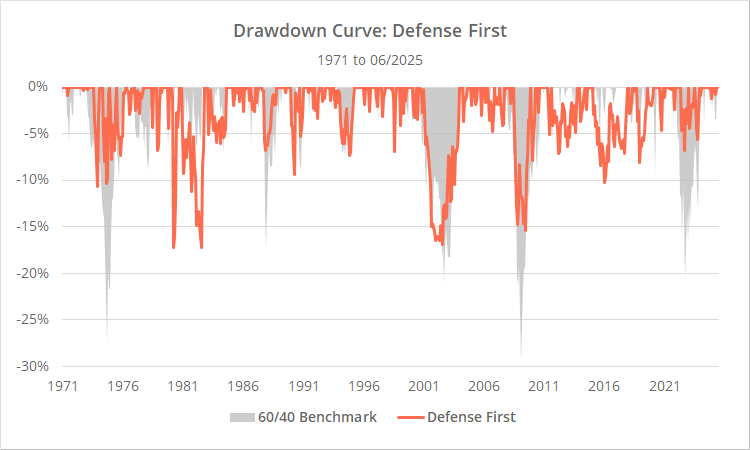
Defense First would have produced benchmark-like returns after ~1980, but its focus on defensive assets means it would have generally done a better job weathering market downturns. Importantly, Defense First has exhibited relatively low correlation to other tactical strategies, potentially making it a useful diversifier when combined with other strategies in a Model Portfolio.
Defense First turns conventional Tactical Asset Allocation (TAA) on its head. A common tactical approach, shared by many strategies we track, is using risk asset momentum (ex. stock momentum) to guide the risk posture of the entire portfolio. When risk asset momentum is positive, the portfolio tilts towards risk, otherwise towards defensive assets.
Defense First instead uses defensive assets to guide the risk posture of the portfolio, only holding risk assets when defensive assets are not exhibiting strong momentum.
Strategy rules tested:
-
At the close on the last trading day of the month, measure the momentum of four defensive assets: long-term US Treasuries (represented by TLT), gold (GLD), commodities (PDBC) and the US dollar index (UUP), plus a risk-free rate represented by 13-week US T-bills (BIL).Momentum is measured as the average of each asset’s 1, 3, 6 and 12-month dividend-adjusted % return.
- Rank the four defensive assets from highest to lowest momentum, with portfolio allocation to each as follows: 40% (top rank), 30%, 20% and 10%.
-
If a defensive asset’s momentum is less than that of T-bills, allocate that portion of the portfolio to US stocks (SPY).This is a form of “dual momentum”. Assets must exhibit positive momentum, with higher momentum assets allocated a larger % of the portfolio.
- Hold all positions until the end of the following month. Rebalance monthly regardless of whether there is a change in position.
Does negative momentum in defensive assets predict positive stock returns? No, but yes.
Obviously, if we’re using defensive asset momentum to determine when to hold US stocks, we should consider whether defensive assets perform that task well. If not, then we’re blindly dumping the portfolio to an inherently risky asset.
First, we’ll test stock market performance (SPY) in the month following positive or negative excess momentum for each defensive asset (by “excess momentum” we simply mean the asset’s momentum relative to T-bill momentum):
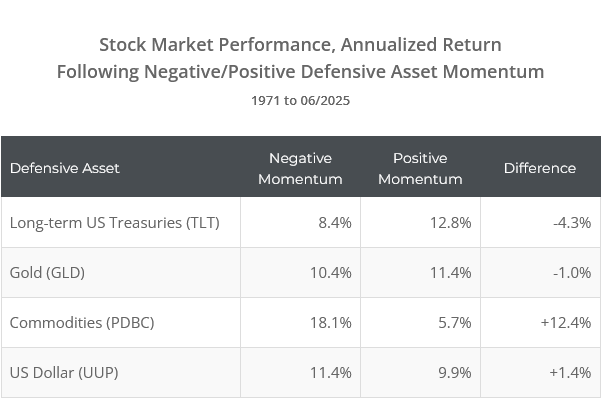
Note: We looked at more than simply annualized return in our analysis, but we’re only showing this single stat to keep things simple.
Broadly speaking, when viewed individually like this, defensive assets do a poor job predicting next month stock market returns.
Commodities have been predictive, but gold and the US dollar have not, and US Treasuries have actually been negatively predictive (i.e. stocks are stronger following strong excess treasury momentum, but we already know that).
But that’s not the whole story.
Remember, if just one of these assets were exhibiting negative excess momentum, the strategy’s allocation to stocks would be just 10%, a pittance. What we really want to measure is stock market performance following weak excess momentum across multiple defensive assets.
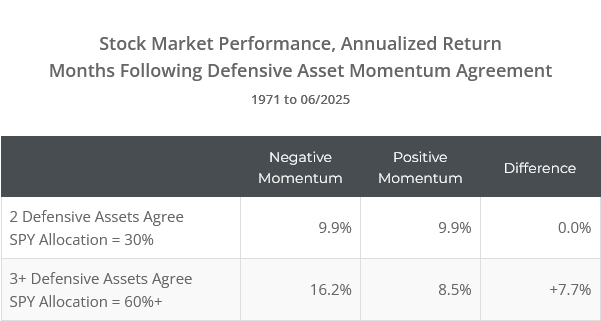
These results show that:
- When 2 defensive assets agree, stock returns have been middling. That’s okay though; exposure to stocks is only 30%, so this is still a relatively defensive portfolio.
- When 3+ defensive assets agree, the signal has been predictive of outsized returns. At this point, exposure to stocks is high enough (60%+) to have a significant impact on the portfolio.
- We did not show results specifically for all 4 defensive assets agreeing, because the number of historical instances was too small to be significant.
In short, yes, when viewed as a whole and not individually, negative excess momentum in defensive assets has been reasonably effective at predicting strong future stock market returns. Having said that, we still have some reluctance (see below).
Thoughts on strategy design: something good, something bad
First, something good:
The stats presented in the previous section show that this strategy was primed for overfitting to the past. Carlson could have boosted historical results by using different rules for each defensive asset, especially Treasuries versus commodities. We appreciate that he’s kept the ruleset simple and consistent, and more likely to be robust to an unknown future.
Something we would consider changing:
The strategy does not require stock momentum to be positive. It blindly dumps the portfolio to stocks when defensive momentum is negative, regardless of what stocks are doing at that moment.
This all feels like the “dumping to bonds” flaw in reverse. For the uninitiated: some strategies are designed to blindly dump to long-duration bonds when the strategy shifts to defense. That worked for most of the market’s history but failed miserably in 2022 when risk assets and bonds fell simultaneously to a degree not seen in 100 years. This feels the same, but in reverse (read more).
We would consider a rule like “stock exposure cannot exceed X% when stock momentum is negative, unallocated funds remain in cash”. In our tests, there would have been little impact on long-term performance, but the portfolio would be more robust to an uncertain future.
Lastly, consider holding cash, not the US Dollar (UUP):
This is the first strategy we track that holds the US Dollar index (UUP). We followed suit in our results, but here’s an important caveat: We would strongly consider holding cash whenever the strategy is signaling a position in UUP.
Currencies tend not to move much month to month. Our results assume trading costs (transactions fees + slippage) of 0.1% per trade, 0.2% round-trip.
The strategy’s average allocation to UUP at any given time would have been ~10%. But despite being a significant holding, UUP would have contributed very little to overall return even before accounting for trading costs – just 0.06% annually.
After accounting for trading costs, the position in UUP is an almost guaranteed loser. Again, it’s simply a function of how little currencies move relative to our trading cost assumption.
Even if in your real-world trading environment transaction fees are zero, you still have slippage to contend with, as well as the opportunity cost of not earning a risk free return on cash.
Outro:
Defense First is a unique take on conventional TAA. As readers know, we seek out unique ideas like this, because combining dissimilar strategies helps to control portfolio volatility and risk.
A big thank you to Thomas Carlson for authoring this paper and giving us the chance to put it to the test. Carlson is a long-time member to Allocate Smartly and has provided valuable feedback to us over the years. This was his first published paper and we’re looking forward to more from him in the future.
New here?
We invite you to become a member for about a $1 a day, or take our platform for a test drive with a free membership. Put the industry’s best Tactical Asset Allocation strategies to the test, combine them into your own custom portfolio, and follow them in real-time. Learn more about what we do.
