This is a test of a tactical asset allocation strategy from David Varadi of CSS Analytics. I’ve been a long-time fan of David’s work. David always devises unique approaches to trading, swimming just outside the mainstream. This strategy is a good example of that. The strategy is notable for its extremely low volatility relative to return.
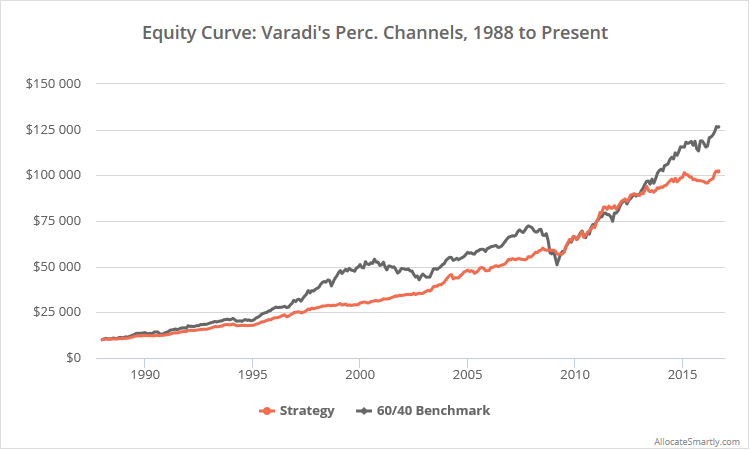
Results from 1988 follow. Read more about our backtests or become a member to follow this strategy in near real-time.
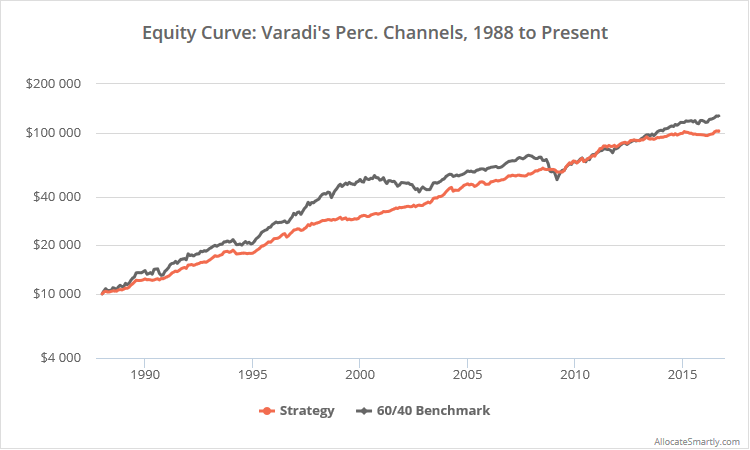
Logarithmically-scaled. Click for a linearly-scaled chart.
Varadi’s Percentile Channels is essentially a momentum strategy, with a stricter threshold for entry, but a more lax threshold for exit. Put another way, it will delay entry into a position compared to many momentum strategies, but once in a position, it will tend to remain there longer. The strategy considers risk-parity in determining how to weight assets.
Let’s review summary stats, and then we’ll discuss strategy rules:
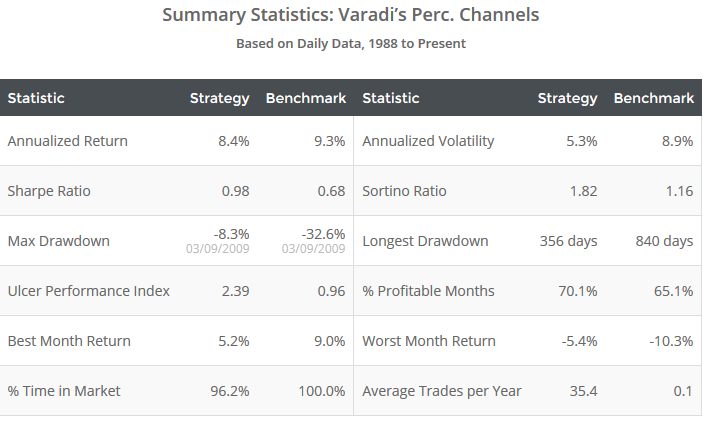
As the summary stats show, this strategy is notable for its extremely low volatility relative to the benchmark. In fact, it has exhibited the lowest annualized volatility of any strategy that we track.
That’s partially a result of the risk-parity incorporated into the strategy (more on this in a moment). Removing this risk-parity component would have increased annualized volatility by 19%. But it’s more the result of simply successful timing and time spent out of the market. Maintaining risk-parity, but assuming all assets were always fully long, would have increased volatility by 55%.
Strategy Rules
These strategy rules are a tad complicated to follow, but not mathematically challenging. I do a cursory overview here, and at the end of this post, I link to three other sources to fill in any gaps:
-
(click to zoom)
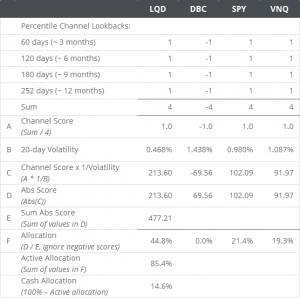
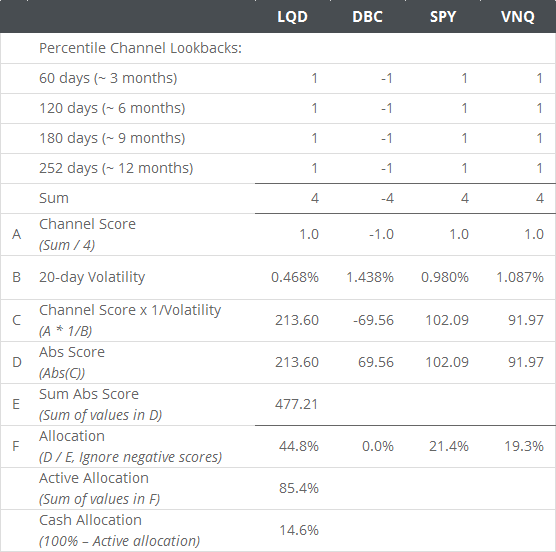
At the close on the last day of the month, calculate 60, 120, 180 and 252-day percentile channels (representing roughly 3, 6, 9 and 12 months), for each of four assets classes: US equities (represented by SPY), real estate (VNQ), corporate bonds (LQD) and commodities (DBC). That’s a total of 16 asset/lookback combinations.
- A given asset/lookback combination has a 75th percentile threshold for entry and 25th percentile threshold for exit. Each asset/lookback combination that is “long” is assigned a value of +1, otherwise a value of -1. Note that this strategy is long-only; the -1 value is used as part of the strategy calculations, but is later discarded.
- Portfolio weights are calculated as shown in the image to the right (reproduced from CSS Analytics). Click to zoom.
- Positions are held until the final trading of the following month. The entire portfolio is rebalanced monthly, regardless of whether there is a change in position.
I like how David scales into entries/exits by dividing each asset among four different lookbacks. I prefer this to a very binary approach where an asset is either all in or all out, as I think it’s less prone to curve-fitting and easier to trade psychologically.
Historically, all 16 asset/lookback combinations have been effective. In the table below I’ve shown all 16 combinations, and that asset’s monthly return vs volatility (geometric average return / standard deviation) when that combination signaled long vs otherwise. Note that in all 16 cases, return vs volatility was improved. That’s particularly impressive considering that our test added about 8 1/2 years of out-of-sample results to those David originally published, and that these results hold even during that out-of-sample period.
| Asset | Look back |
R/V When Long |
R/V Not Long |
R/V Diff. |
|---|---|---|---|---|
| SPY | 60 | 0.21 | 0.18 | 0.03 |
| SPY | 120 | 0.27 | 0.09 | 0.17 |
| SPY | 180 | 0.29 | 0.05 | 0.24 |
| SPY | 252 | 0.32 | -0.03 | 0.35 |
| VNQ | 60 | 0.29 | 0.06 | 0.23 |
| VNQ | 120 | 0.31 | 0.01 | 0.30 |
| VNQ | 180 | 0.30 | 0.01 | 0.29 |
| VNQ | 252 | 0.29 | 0.02 | 0.26 |
| LQD | 60 | 0.33 | 0.31 | 0.02 |
| LQD | 120 | 0.39 | 0.18 | 0.21 |
| LQD | 180 | 0.39 | 0.15 | 0.24 |
| LQD | 252 | 0.36 | 0.23 | 0.13 |
| DBC | 60 | 0.24 | -0.12 | 0.36 |
| DBC | 120 | 0.15 | -0.02 | 0.17 |
| DBC | 180 | 0.18 | -0.07 | 0.25 |
| DBC | 252 | 0.13 | -0.04 | 0.18 |
Further reading:
For additional information about this strategy, we recommend the following sources.
Our results are a bit more pessimistic than you’ll find elsewhere, both because of our strict backtest assumptions and strict requirements when building simulated data, but note that during overlapping periods, using similar assumptions and data sources, our results closely match those below.