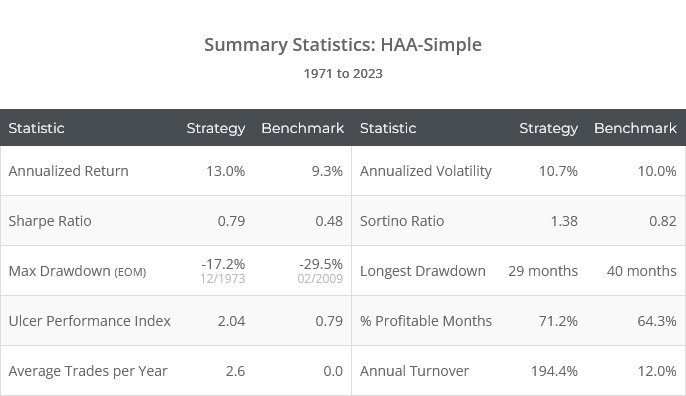
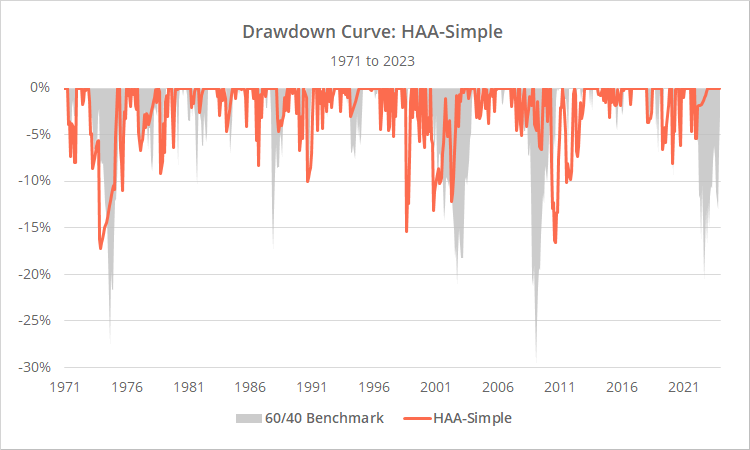
This is a test of the “simple” variation of Dr. Keller and Keuning’s strategy from their paper Dual and Canary Momentum with Rising Yields/Inflation: Hybrid Asset Allocation (HAA). We’ve covered the “balanced” version of HAA previously. It has become one of the more popular strategies on our platform, and members have asked us to add this simpler-to-execute variation as well.
Backtested results from 1971 follow. Results are net of transaction costs – see backtest assumptions. Learn about what we do and follow 80+ asset allocation strategies like this one in near real-time.
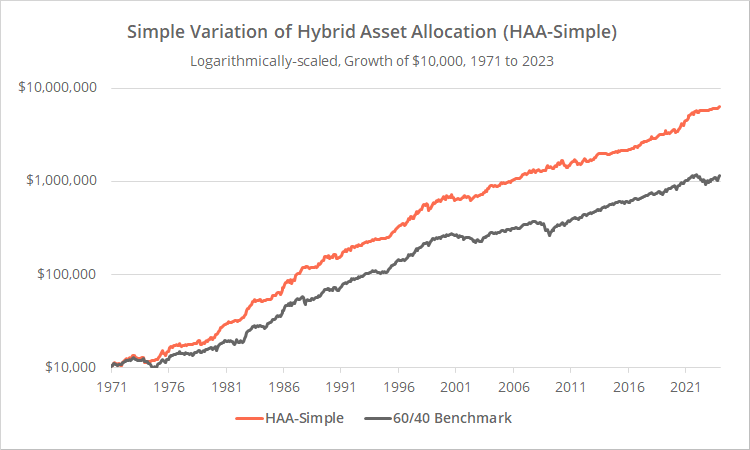
Logarithmically-scaled. Click for linearly-scaled chart.
Comparing these results to our previous test of HAA-Balanced, readers will note that HAA-Simple has generally performed poorer in both absolute terms (annual return = 13.0% vs 15.8%, max drawdown = -17.2% vs -10.0%) and relative terms (Sharpe ratio = 0.79 vs 1.25). That shouldn’t be too surprising; with simplification often comes some loss of effectiveness.
Strategy rules tested:
We’re not going to dive as deep into HAA-Simple as we did with HAA-Balanced, because our analysis is essentially the same. Strategy rules follow (see HAA-Balanced for a more verbose description):
-
At the close on the last trading day of the month, measure the momentum of US Treasury Inflation-Protected Securities (represented by the ETF TIP) and the S&P 500 (SPY).Momentum = unweighted average of 1, 3, 6 and 12-month % return
- If both TIP and SPY momentum is positive, go 100% long SPY at the close.
- If either TIP or SPY momentum is negative, measure the momentum of intermediate-term (IEF) and short-term (BIL) US Treasuries.
- If IEF momentum > BIL momentum, go 100% long IEF at the close, otherwise to cash.
- Hold all positions until the last trading day of the following month.
A summary of our thoughts about HAA-Balanced that also apply to HAA-Simple:
- Ignoring the TIPS rule, HAA is employing the type of classic trend-following that has worked for essentially as long as financial markets have existed. That should give investors a level of comfort. The TIPS rule is where HAA differentiates itself from other strategies.
- We are proponents of this general idea of using bond momentum (TIPS or otherwise) to time risk assets. We’ve covered this idea a number of times on our blog (example). Investors should be careful not to take too much exposure to this one idea as a number of strategies now employ it. Strategic diversification is key.
-
We have some concerns about simulating the long-term performance of TIPS. TIPS index data does not exist prior to 1997. More than any other asset class we cover, historical TIPS simulations should be taken with an extra-large grain of salt. They are an educated guess.Because of this, we provide a more “adversarial” test replacing TIPS with rock solid US Treasury data later in this post.
-
We rarely say that strategy X is better than strategy Y. It’s just not what we do. We provide the tools to hopefully allow investors to make those determinations for themselves.Having said that, we would remind readers that we strongly prefer HAA (either variation) to Keller’s previous strategy Bold Asset Allocation. We expressed concerns about overfitting with BAA. We feel much more comfortable with the straightforward approach taken by HAA.
Which is better, HAA-Balanced or HAA-Simple?
All things being equal, HAA-Balanced has performed better on paper than HAA-Simple pretty much across the board, from return and drawdown to risk-adjusted measures like Sharpe and UPI.
Further, HAA-Simple bears the added risk of allocating 100% of the portfolio to a single risk asset. Although to be fair, HAA-Balanced is also often 100% allocated to risk, simply split across 4 risk assets. Practically speaking, that isn’t much different. It’s important to use appropriate caution and combine both variations of HAA with other strategies in a Model Portfolio.
Even though HAA-Balanced would have outperformed in the past, there are three reasons why an investor may still prefer HAA-Simple:
- It’s simpler to execute because it trades less frequently and holds less assets.
- It’s a bit more tax efficient because it’s not rotating among risks assets for marginal benefit (but warning: it’s still overall quite tax inefficient). That may or may not matter depending on the account type.
- The investor may have limitations on asset classes available to them for a variety of reasons (account type, non-US investors, etc.) With just two assets to worry about (plus cash), HAA-Simple is accessible to just about anyone.
More “adversarial” test of HAA-Simple:
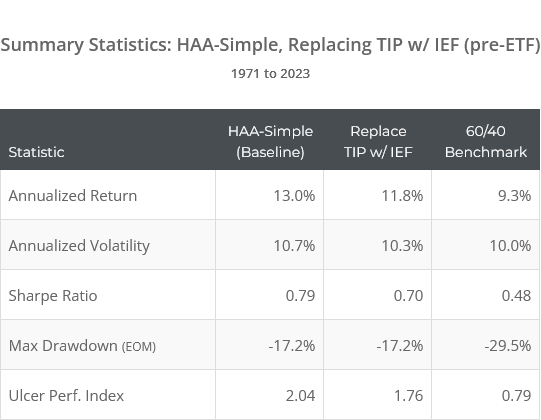
TIPS are a key component of HAA, but as mentioned, we have some concerns about simulating the long-term performance of TIPS. Below we’ve provided a more adversarial test. We replace TIPS with rock solid US Treasury data (IEF) prior to the launch of the actual TIPS ETF in 12/2003.
The result? Very little impact on historical results beyond a brief period in the late 70’s/early 80’s. That’s encouraging. That robustness is likely due to the simplicity of HAA and how little opportunity there is for overfitting to the historical data.
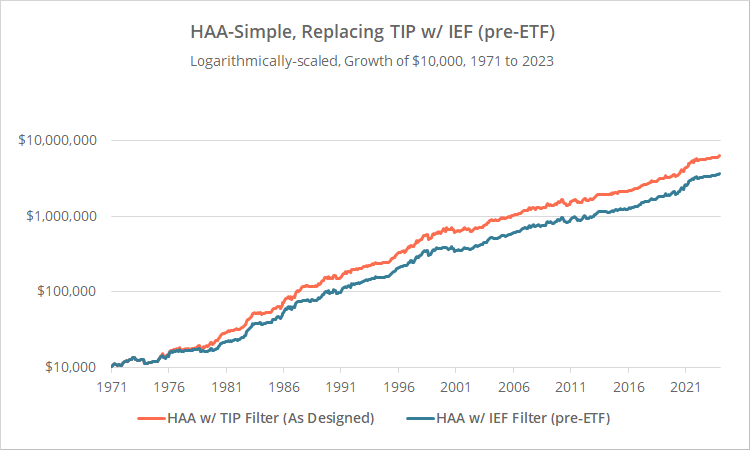
Logarithmically-scaled. Click for linearly-scaled chart.
Outro:
We didn’t do our usual deep dive into HAA-Simple, but again, most of our analysis of HAA-Balanced holds here as well.
HAA is a simple strategy with minimal risk of over-optimization that gives straightforward exposure to this concept of using bond momentum to time risk assets.
If we could put one thing on our wish list, it would be to marry this core idea with something like the “high momentum diversification” concept from Financial Mentor’s Optimum3 to reduce the highly concentrated risk exposure both variations of HAA are prone towards. Just putting a bug in the ear.
As always, a big thank you to Dr. Wouter Keller and JW Keuning for allowing us to put Hybrid Asset Allocation to the test. Both of these gentlemen have done much to push TAA strategy design forward with a continuous stream of novel ideas. Unfortunately, Dr. Keller doesn’t have an online presence, but we highly recommend following JW Keuning on his website TrendXplorer.
New here?
We invite you to become a member for about a $1 a day, or take our platform for a test drive with a free membership. Put the industry’s best Tactical Asset Allocation strategies to the test, combine them into your own custom portfolio, and follow them in real-time. Learn more about what we do.
* * *
Calculation notes:
- All calculations throughout this post are based on each asset’s dividend-adjusted closing price.
- As in the authors’ original paper, for the three years prior to EOY 1973, we used int-term US Treasuries (IEF) in place of TIPS due to a lack of historical TIPS data.
