This is an independent test of a series of interesting studies from Quantpedia (here and here) related to seasonality in commodity ETFs. We’ve more than doubled the length of the author’s original test using relevant index data (1).
Test #1: Front running commodity seasonality
In all of our tests, we will be trading the same 4 commodity ETFs chosen by the author:
- DBA: Agriculture
- DBB: Base/Industrial Metals
- DBC: Energy
- DBP: Precious Metals
At the close of each month we allocate 25% of the portfolio – either long or short – to each ETF based on that ETF’s performance in month n-11, where n is the month we’re positioning in advance of (2).
In other words, at the end of December, we predict January’s performance based on the previous February’s performance relative to all months since. If February was >= the 50% percentile, we go long that ETF, otherwise we go short. All positions are held until the end of the following month.
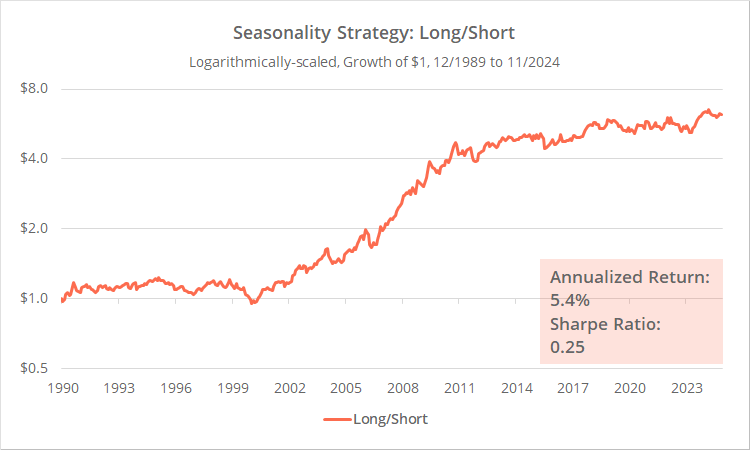
Results since 1990 follow. This is a proof of concept, so unlike nearly all the other tests you’ll find on this site, we’ve ignored important real-world considerations, like transaction costs and shorting costs.
Note the big run up from 2000 to 2010. Results outside of that period have been essentially flat.
Results are largely dominated by DBE (Energy) because it’s been the biggest mover (both up and down) of the 4 ETFs. Could that big run up be solely due to DBE or some other more volatile ETF?
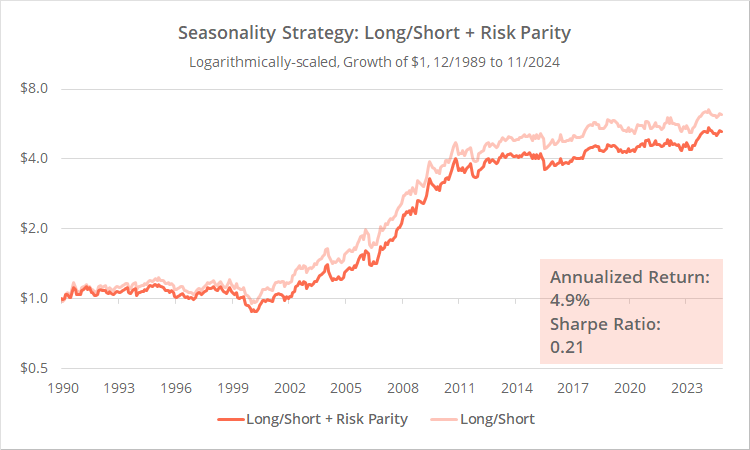
To answer that, next we test a risk parity version of the strategy (based on trailing 36-month volatility). In this test, position sizes in more volatile ETFs like DBE will be smaller, while positions sizes in less volatile ETFs like DBA (agriculture) will be larger, to balance the impact of each ETF.
This new risk parity test is shown in dark orange and the original test in light orange.
That run up from 2000 to 2010 is more or less unchanged. It is not the result of more volatile ETFs dominating results.
Test #2: Improving results with intra-market correlation
The author finds that when the average short-term correlation (20-day) between our 4 ETFs is lower than the average long-term correlation (250-day), the seasonality strategy would have outperformed. The author speculates that higher dispersion among commodities makes it easier for the strategy to distinguish actual seasonality from noise.
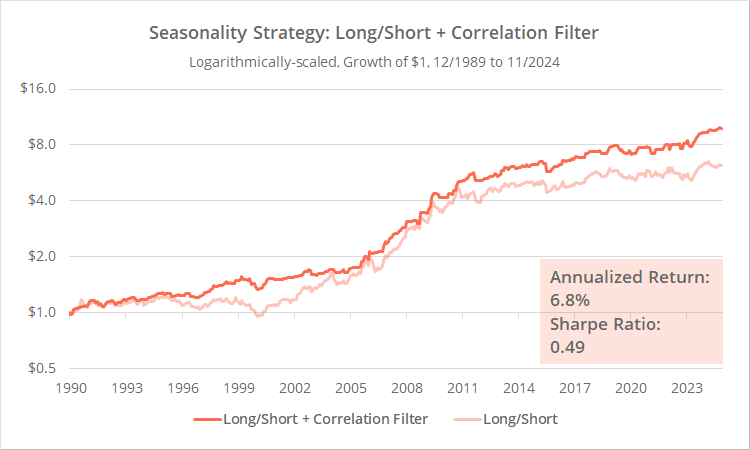
To test that idea, below we show our original test (light orange) versus our new strategy that takes into account intra-market correlation (dark orange). When average short-term correlation exceeds average long-term correlation, the strategy switches to cash.
Note the improvement in the Sharpe Ratio and generally more consistent performance, despite roughly half of the exposure to the market. The correlation filter appears to be a useful addition and we wonder if it might have a positive impact on other strategies we track.
Test #3: Long-only results:
Shorting obviously involves complications that our test doesn’t account for (additional costs, share availability).
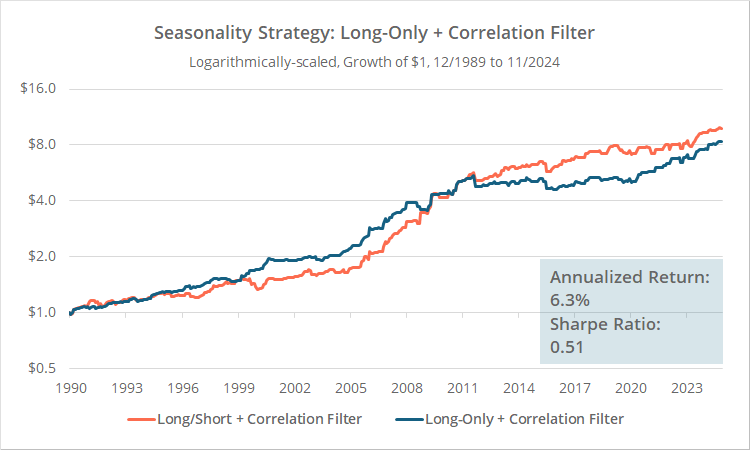
Below we’ve tested a long-only version of the strategy (blue). This long-only version also accounts for intra-market correlation. Rather than going short, the strategy instead switches to cash. For comparison, we’ve included our previous long/short test (orange).
The strategy’s overall, long-term results would have been similar, but the sequence of returns changed. Each excelled at different points in the test, but one could argue the long-only version produced more stable, consistent results.
Test #4: Commodity momentum + reversal + correlation filter:
Lastly, we test a different strategy from the author which combines momentum, reversal and the correlation filter.
At the close of each month, if average short-term correlation exceeds average long-term correlation, we go long the 2 ETFs with the highest 12-month return and short the 2 ETFs with the lowest. If short-term correlation is lower than long-term correlation we reverse the rules, going short the 2 ETFs with the lowest 12-month return and long the 2 ETFs with the highest.
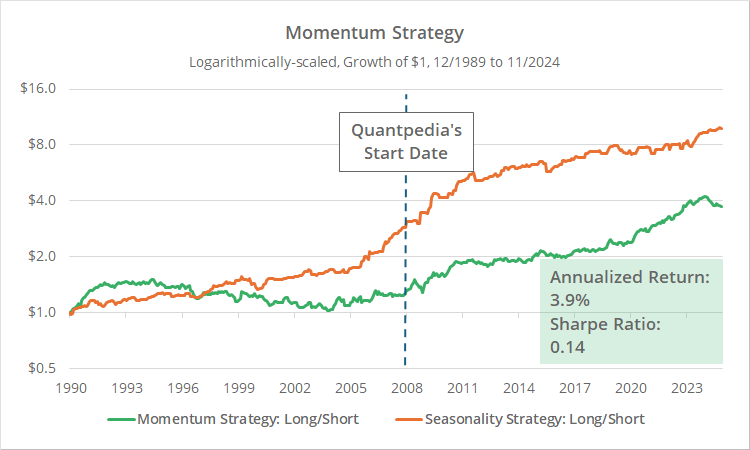
This momentum strategy is shown in green and our previous long/short seasonality strategy w/ correlation filter in orange. The vertical dotted line is the start of the author’s original test.
This idea would have worked over the specific period tested by the author, but would have been ineffective in all years prior. Unlike our previous tests of the seasonality strategy, this one failed in our out-of-sample test.
Outro:
A big thank you to Quantpedia for posting these ideas.
We expected the seasonality strategy to fail and the momentum strategy to hold up under our extended test. We were proven wrong; the opposite was true. We don’t think the seasonality strategy is ready for actual trading, but it’s a unique idea that other developers may explore further. At the very least, we think the author’s correlation filter deserves further research.
Shortly after completing this research, Quantpedia posted a new analysis applying these same ideas to stock market sectors. Consider this one on our todo list to test as well. We have the data to extend their sector analysis by about a decade.
New here?
We invite you to become a member for about a $1 a day, or take our platform for a test drive with a free membership. Put the industry’s best Tactical Asset Allocation strategies to the test, combine them into your own custom portfolio, and follow them in real-time. Learn more about what we do.
* * *
(1) We’ve simulated ETF performance prior to inception using index data from Deutsche Bank (which these ETFs track) when available, otherwise we use similar indices from Bloomberg and S&P GSCI.
(2) We think this is more aptly described as month n-10 (not n-11), but we’re following the author’s nomenclature.
(!) We mentioned this previously, but just to be clear: this test was meant as a proof of concept, so unlike nearly all the other tests you’ll find on this site, we’ve ignored important real-world considerations, like transaction costs and shorting costs.
