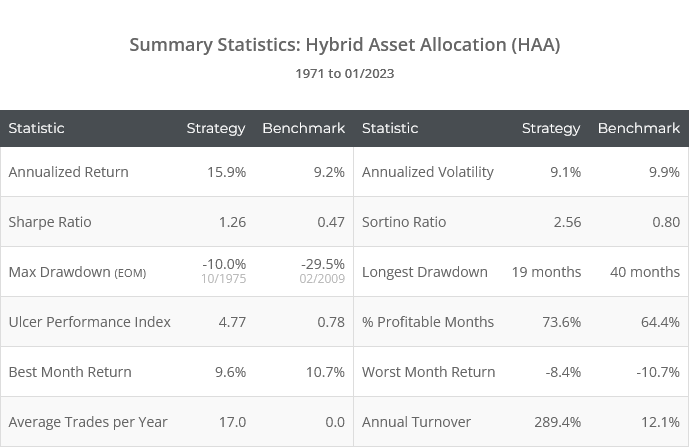
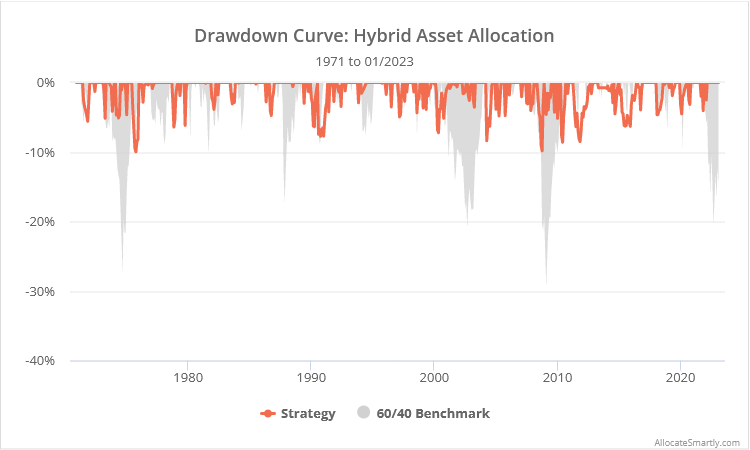
This is a test of the latest tactical asset allocation strategy from Dr. Wouter Keller and JW Keuning and their paper: Dual and Canary Momentum with Rising Yields/Inflation: Hybrid Asset Allocation (HAA).
Backtested results from 1971 follow. Results are net of transaction costs – see backtest assumptions. Learn about what we do and follow 70+ asset allocation strategies like this one in near real-time.
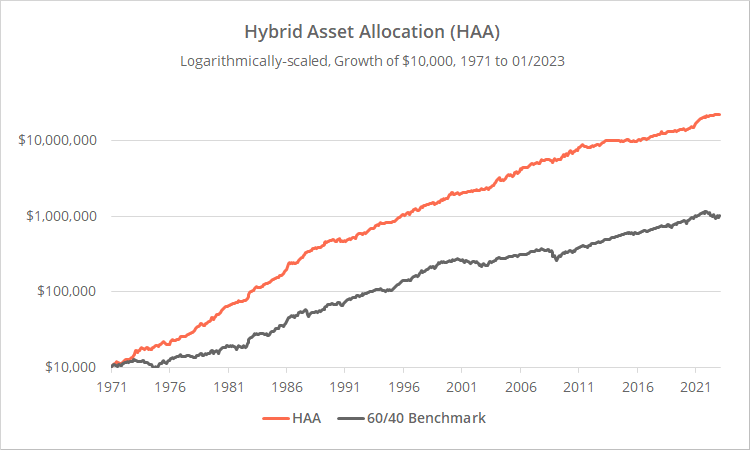
Logarithmically-scaled. Click for linearly-scaled chart.
When Keller released Bold Asset Allocation last year, we shared our concerns about the complexity of the strategy and the potential for unintentional overfitting. He has responded with this more streamlined strategy that makes it easier to understand the sources of historical outperformance, and how likely it is for that outperformance to persist. We discuss further later in this post.
Strategy rules tested:
HAA uses the same simple measure of momentum throughout the strategy to capture both short and long-term momentum:
Momentum = unweighted average of an asset’s 1, 3, 6 and 12-month % return
This simple measure is similar to a number of other strategies we track including Meb Faber’s classic GTAA 13 and Agg 3/6, and Brian Livingston’s Papa Bear.
-
At the close on the last trading day of the month, measure the momentum of US Treasury Inflation-Protected Securities (TIPS, ETF: TIP).The strategy uses TIPS as a “canary asset” to determine whether to allocate to either an offensive or defensive asset universe. Since 1971, the momentum of simulated TIPS would have been positive about 86% of the time, meaning the vast majority of the time we would be allocating to the offensive asset universe.
-
If TIPS momentum is positive, select the four assets with the highest momentum from the following offensive asset universe:US large caps (represented by SPY), US small caps (IWM), developed international stocks (EFA), emerging market stocks (EEM), US real estate (VNQ), commodities (PDBC), intermediate-term US Treasuries (IEF) and long-term US Treasuries (TLT)For each of those four assets, if momentum is positive, allocate 25% of the portfolio to the asset, otherwise allocate that portion of the portfolio to cash either intermediate-term US Treasuries (IEF) or cash, depending on which has the highest momentum (US T-Bills are used as a proxy for cash momentum) (*).This is what’s known as “dual momentum”. The asset must exhibit both positive momentum (aka “time series momentum”) as well as high momentum relative to competing assets (aka “cross-sectional momentum”).Note: Commodities and treasuries are generally considered defensive assets, so the offensive portfolio will still be diversified in many cases.
- If TIPS momentum is negative, allocate the entire portfolio to either intermediate-term US Treasuries (IEF) or cash, depending on which has the highest momentum.
- All positions are executed at the close. Hold all positions until the last trading day of the following month. Rebalance monthly, even if there is no change signaled.
Calculation note: The authors used US T-Bills (represented by the ETF BIL) in place of our more generic “cash”. As we do throughout this site, we’ve replaced BIL with cash as it’s likely a more appropriate short-term vehicle for most investors for the foreseeable future.
Classic Tactical Asset Allocation with an extra bit of something:
The meat of HAA is really the classic Tactical Asset Allocation (TAA) that investors have come to trust. The strategy spends the vast majority of months (86%) selecting from a diversified universe based on a tried-and-true measure of dual momentum, not unlike many other strategies that we track. That should give investors a level of comfort.
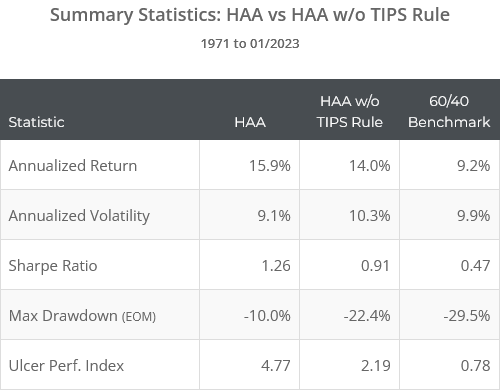
To illustrate, below we’ve shown the full strategy in orange, versus a simplified strategy that always selects from the offensive universe (i.e. ignores the TIPS rule) in blue. The simplified strategy has clearly been inferior but has still significantly outperformed the benchmark.
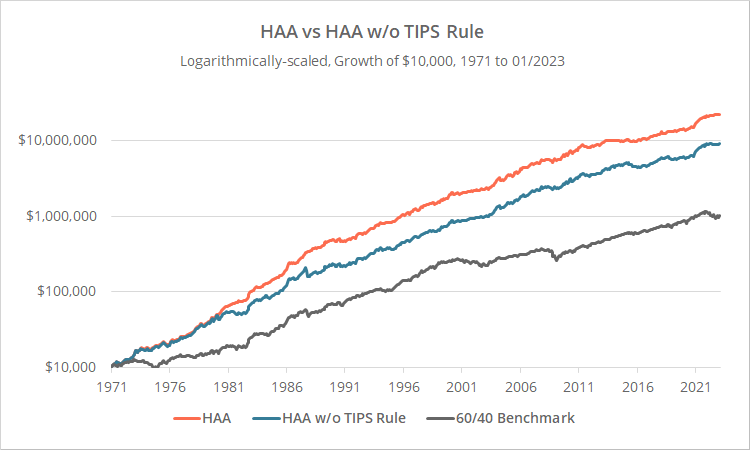
Logarithmically-scaled. Click for linearly-scaled chart.
The strategy’s TIPS rule is the only divergence from classic TAA, but it’s what has really pushed the strategy into the rarified air of exceptional performance, so let’s drill down on just that portion of the strategy.
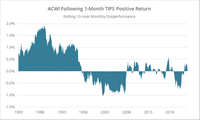
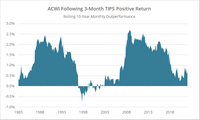
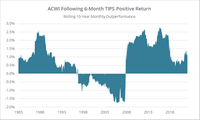
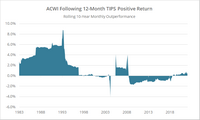
Recall that our simple measure of TIPS momentum is the average of TIPS’ 1, 3, 6 and 12-month return. Below we’ve shown the 10-year rolling outperformance of a generic risk asset in the month following when TIPS momentum has been positive versus negative over the previous n-months.
Positive values indicate that when TIPS momentum was positive it signaled stronger future outperformance than when it was negative, and vice-versa. We’ve used a global stock index (ETF: ACWI) as our generic risk asset because it incorporates many of the smaller asset classes traded by the strategy.
[click to zoom on individual charts]

Calculation note: Unlike the other data in this post, these results do not account for trading frictions.
The key takeaways from the graphs above:
- The bad: While TIPS momentum has generally been a good predictor of future risk asset outperformance over the full sample (especially when all four of the momentum lookbacks are combined), the effect waned for long periods of time and has been less effective than average over the last decade.
- The good: Some of that inconsistency in our TIPS momentum indicator is likely due to how infrequently it signals negative momentum (meaning these results are very noisy), so the full sample may be more relevant. Further, it did a near perfect job calling a difficult market over the previous year.
A further consideration: Data quality of historical TIPS data:
Actual US TIPS did not exist prior to 1997. More so than other asset class we cover, historical TIPS simulations should be taken with an extra-large grain of salt. They are a best guess.
As we’ve previously discussed (the best example being this post), bonds in general have been predictive of risk asset performance (so called “cross-asset momentum”), so let’s look at how the strategy would have performed using intermediate-term US Treasuries (ETF: IEF) in place of TIPS.

Logarithmically-scaled. Click for linearly-scaled chart.
An IEF filter would have still provided value when compared to no filter over the entire backtest (in terms of reducing risk and improving risk-adjusted returns), but not to the same degree as the TIPS filter. Further, most of the benefit of IEF came in the first half of the sample (prior to the mid-1990’s), with little benefit thereafter.
How significant is this?
An optimist would say, not very. TIPS give us insights into the market beyond what treasuries do by capturing not just changes in yields, but also expected and actual inflation. Here’s a great series of posts on TIPS from Eversight Wealth (previously Momentum Capital).
A pessimist would say the returns based on US Treasuries (which are still very good) are a better indicator of future performance because of concerns about historical TIPS data quality.
Our take on TIPS as a predictor:
Broadly speaking, there is something significant in this “bonds as predictors of future risk asset performance” observation. We’ve seen it in a number of strategies, and there’s even a great paper examining the effect across global markets. It’s not a foolproof observation (nothing is), but it’s also not just noise. We think it’s perfectly reasonable to have some exposure to this observation.
Importantly, investors should take comfort that even if HAA’s specific “TIPS as predictor” observation fails to outperform moving forward, most of HAA’s performance has come from tried-and-true momentum and trend-following rules.
As always, regardless of how well a strategy has performed historically or how much faith an investor places in that strategy, investors should continue to combine multiple strategies together, each taking a unique approach to the market, to protect against any of them going off the rails (a task our platform was specifically built to tackle).
Other random highlights:
Bad: HAA has been very tax in-efficient with 54% of gains coming from short-term capital gains. That may or may not matter depending on the account type traded. Members: See the full Tax Analysis.
Good: Smooth historical returns means that HAA has some of the highest “Safe Withdrawal Rates” of any strategy we track (i.e. the amount that could be withdrawn each year in retirement with an inflation adjustment). Of course, the usual warnings about past performance not necessarily being indicative of future results apply. Members: See the full Withdrawal Rate Analysis.
Very Good: Based on our analysis, HAA has relatively low exposure to long-term rising interest rates. That’s important; a big lesson for strategy developers over the last year was the importance of timing defensive assets like treasuries in the same way we do risk assets. Members: See the full Exposure to Rising Rates analysis.
Final thoughts:
We almost never say strategy X is better than strategy Y. It’s just not what we do. We provide the tools to hopefully allow investors to make those determinations for themselves. Having said that, we do prefer Hybrid Asset Allocation over Keller’s previous Bold Asset Allocation.
Could BAA outperform HAA in the future? Absolutely. But only knowing what we know today, HAA’s historical performance is much easier to understand and the backtest feels more robust, making us more more confident in the strategy’s ability to continue to perform out of sample
A big thank you to Dr. Wouter Keller and JW Keuning for allowing us to put Hybrid Asset Allocation to the test. Both of these gentlemen have done much to push TAA strategy design forward with a continuous stream of novel ideas. Unfortunately, Dr. Keller doesn’t have an online presence, but we highly recommend following JW Keuning on his website TrendXplorer.
New here?
We invite you to become a member for about a $1 a day, or take our platform for a test drive with a free membership. Put the industry’s best tactical asset allocation strategies to the test, combine them into your own custom portfolio, and follow them in real-time. Learn more about what we do.
* * *
Calculation notes:
- All calculations throughout this post are based on each asset’s dividend-adjusted closing price.
- As in the authors’ original paper, for the three years prior to EOY 1973, we used int-term US Treasuries (IEF) in place of TIPS due to a lack of historical TIPS data.
(*) When we initially wrote this blog post we incorrectly assumed offensive assets with negative momentum were allocated to cash. After consulting with the authors we learned that the rule should read: allocate to either int-term US Treasuries or cash depending on which has the highest momentum. That subtle difference would have resulted in a negligible difference in historical results, so we’re leaving this blog post as is. We’ve updated our code in the members area, so you’ll notice a very small difference between the members area results and those presented in this blog post.
