Most Tactical Asset Allocation (TAA) strategies trade just once per month. Strategy developers almost always assume trades are executed on the last trading day of the month.
A unique feature of our platform is the ability to follow these strategies on any other day of the month as well. We’re not simply executing the same signal on other dates; we’re recalculating the strategy’s entire position, while maintaining the integrity of the original strategy (read more).
Strategy outperformance when trading at month-end:
Historically, TAA strategies have outperformed when traded on the last day of the month (as originally designed). For the average strategy, that performance boost has been about 0.5% per year.
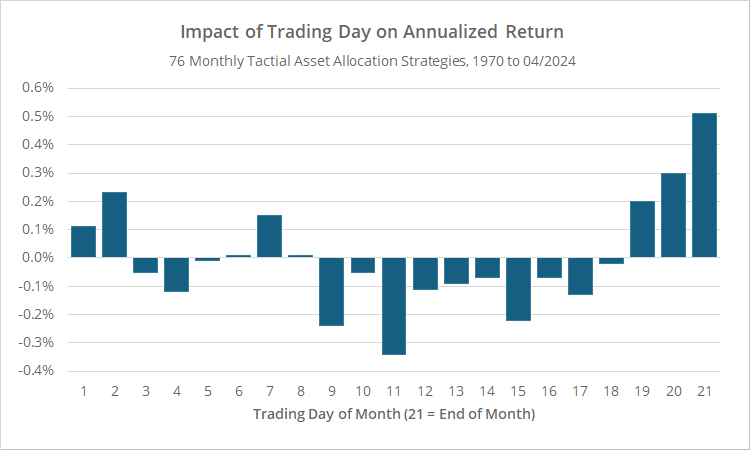
To illustrate, below we look at how the day of the month an investor executed trades would have affected the investor’s annualized return, compared to trading on the average day (*). This data covers 76 TAA strategies as far back as 1970. We normalize all months to have exactly 21 trading days (read more). Day 1 will always be the first day of the month, and day 21 will always be the last.
Note the outperformance when trading around the beginning and end of the month, with peak outperformance when trading on the last day of the month.
We’ve speculated why this month-end outperformance exists. We’re not going to repeat that discussion here, but we recommend interested readers read this deep dive.
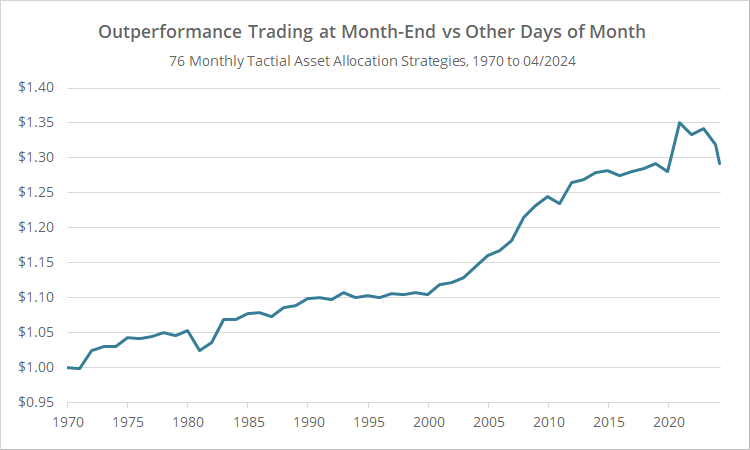
Up until the last few years, that outperformance had been fairly consistent. In the graph below, we assume that an investor captured just the yearly performance boost from trading on the last day of the month.
Note the downturn on the far of the chart. In 3 out of the last 4 years (2021, 2023 and so far in 2024) trading at month-end has been a major drag on performance.
Importantly, we track a lot of published TAA strategies. That means that these results are not specific to us or our platform. These results are broadly representative of TAA as a trading style.
Month-end has been a terrible day to trade in recent years:
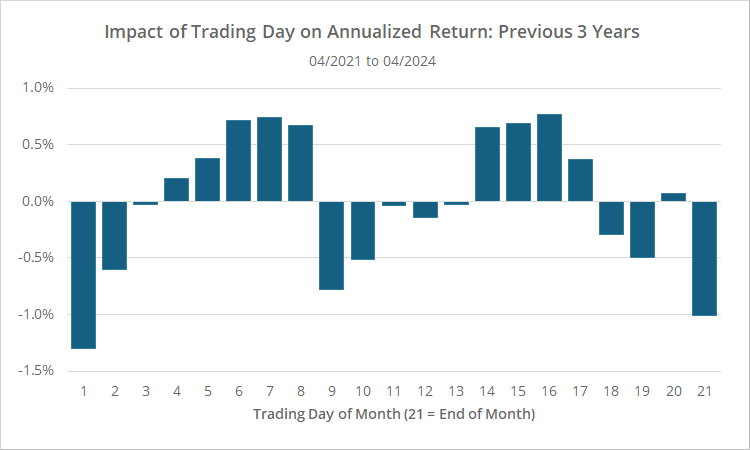
In the graph below we again look at how the day of the month an investor executed trades would have affected the investor’s annualized return, compared to trading on the average day (*). This time however, we’re looking at just the last 3 years (trailing 36 months).
Trading on the last trading day of the month has now been one of the worst performing days, underperforming by about 1% annually.
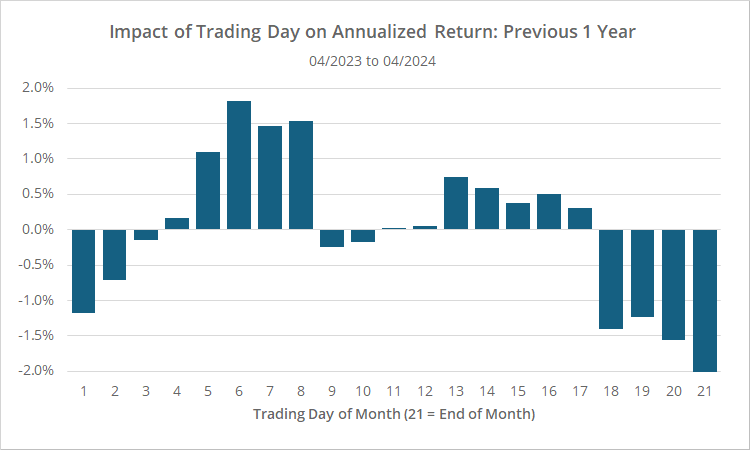
Here are the same results over the last year (trailing 12 months):
Over the last year results have been even more dismal for month-end trading, to the tune of a 2% drag on return for the year. Ouch.
What does this all mean and what should we do about it?
Obviously, we shouldn’t overreact to these results. In the big picture, a year or even three is a short period to consider. This could all just be a product of noise and could reverse course tomorrow. We would not recommend rushing to change your Model Portfolios to only trade on the days that have outperformed in recent years.
Having said that, given the long consistent history of outperformance when trading at month-end, coupled with how poorly it has performed in recent years, it’s entirely possible that this is a sign of something more significant. Perhaps even a natural and expected side effect of the rise in popularity of TAA (which again, usually trades at month-end) in recent years.
What we would consider, for those not already doing so, is taking another look at something we advocate: “tranching” your Model Portfolio.
Many members opt to trade monthly strategies all on the same day of the month. Usually that’s either the last trading day of the month or a nearby day.
But if the investor is willing to up the hassle factor just a bit and spread changes to the portfolio across multiple days of the month, they buy themselves insurance just in case their particular trading day significantly underperforms. It’s simply another form of diversification (it’s the “When” of the What, When and How of diversification).
Practically speaking, how would an investor do that?
Let’s say you decided to combine 3 strategies in your Model Portfolio. One option is to select a different day of the month for each of those 3 strategies (resulting in 3 entries in your Portfolio). A second option is to select 2 or more trading days and then trade all 3 strategies on each of those days (resulting in 6 or more entries in your Portfolio).
Either way, total portfolio turnover (i.e. the dollar value bought and sold) would be roughly the same as going all in on one trading day. We’re simply spreading the changes out throughout the month.
Read other things we’ve written about portfolio tranching.
It’s been a while since we presented a trading day analysis like this because it requires some effort to produce the data ad hoc. We’re planning to add a report to the members area, updated monthly, so members can monitor this issue in real-time moving forward. More to follow.
New here?
We invite you to become a member for about a $1 a day, or take our platform for a test drive with a free membership. Put the industry’s best Tactical Asset Allocation strategies to the test, combine them into your own custom portfolio, and follow them in real-time. Learn more about what we do.
* * *
(*) Calculation note: What do we mean by the “average day”? Let’s assume we’re showing the result for day 21 (the last trading day of the month) compared to the average day.
We first calculate the log annualized return for each of the 21 trading days. We then find the mean of those 21 log annualized returns. This is our “average day”. The value in the charts above for day 21 would be: log ann. return for day 21 – mean log ann. return for all days.


