We track more than 60 Tactical Asset Allocation strategies, which members can combine together into custom portfolios. To make creating those portfolios easier, we provide an optimizer showing the best performing combinations of strategies based on the member’s investment objective, such as maximizing the Sharpe Ratio (risk-adjusted return) or minimizing volatility.
By popular demand, we’ve added another investment objective: Maximizing the Sortino Ratio. Members: Visit the Portfolio Optimizer now and select the “Maximum Sortino Ratio” investment objective.
More on the Sortino Ratio:
The Sortino Ratio is a measure of risk-adjusted return, much like the more well-known Sharpe Ratio.
Both Sharpe and Sortino use portfolio volatility as a proxy for risk. Where they differ is that the Sortino Ratio differentiates between harmful downside volatility and benign upside volatility, whereas Sharpe considers all volatility equally.
As a concept, that sounds like a no brainer; a strategy shouldn’t be penalized for generating positive returns. In practice however, Sortino and Sharpe are closely related and there’s limited advantage of one over the other (at least as it relates to TAA). As a result, one should expect Max Sharpe and Max Sortino portfolios to be very similar.
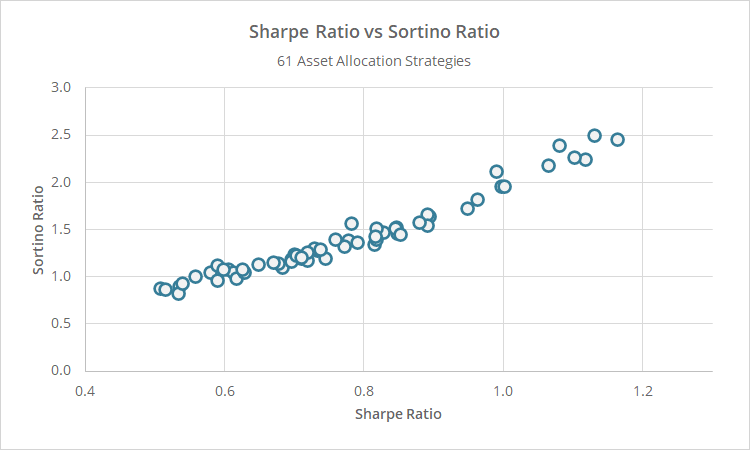
To illustrate, below we’ve plotted the Sharpe Ratio versus Sortino Ratio for all 60+ asset allocation strategies we track. Note the close fit between the two (correlation = 98%).
Despite the similarity between the Sharpe and Sortino Ratios, we now provide portfolio optimizations based on both. Some members favor one over the other and that’s okay. Again however, members should expect the resulting portfolios to look similar.
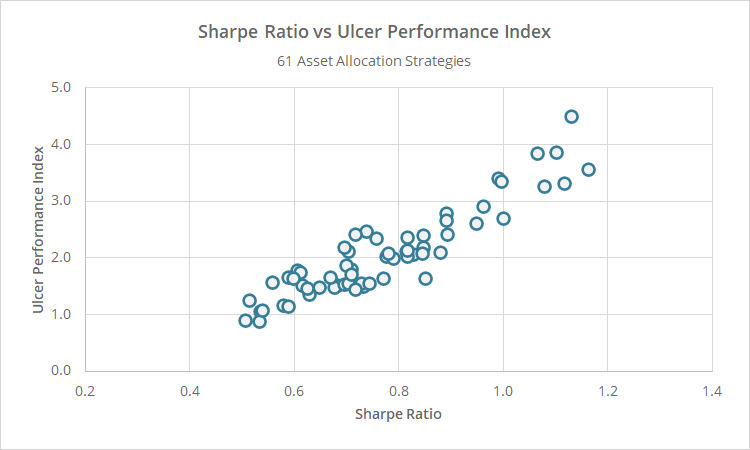
As a side note, there’s a much weaker relationship (and potentially more informational advantage) between Sharpe and another risk-adjusted performance measure that’s a personal favorite of ours, the Ulcer Performance Index (UPI). To illustrate, below we’ve plotted the Sharpe Ratio versus UPI for all strategies we track (correlation = 92%).
Having a UPI-based optimization might be useful and that’s currently on our development path. That’s a more difficult analytical problem requiring an entirely different approach to solve.
Geek note: As we talk about on the Portfolio Optimizer, we make one departure from the conventional approach to optimization. We estimate correlation and variance based on all data available for each strategy, rather than using a common start date based on when the portfolio backtest begins. We think that helps to reduce estimation error and makes for better analysis. A side effect of that though is that you may be able to tweak the portfolios and get slightly better results when backtesting them in a Model Portfolio. That’s especially true here given the similarity between the Sharpe and Sortino. In fact, you may find the Max Sharpe portfolio has a higher Sortino Ratio than the Max Sortino portfolio itself. Is it really better though if it says less about future performance? We don’t think so.
New here?
We invite you to become a member for about a $1 a day, or take our platform for a test drive with a free limited membership. Put the industry’s best tactical asset allocation strategies to the test, combine them into your own custom portfolio, and follow them in near real-time. Not a DIY investor? There’s also a managed solution. Learn more about what we do.
