This test was inspired by Yulong Sun’s paper Navigating Economic Downturns: Insights from Survey-Based Recession Indicators.
Strategy results from 1970 follow. Results are net of transaction costs – see backtest assumptions. Learn about what we do and follow 90+ asset allocation strategies like this one in near real-time.
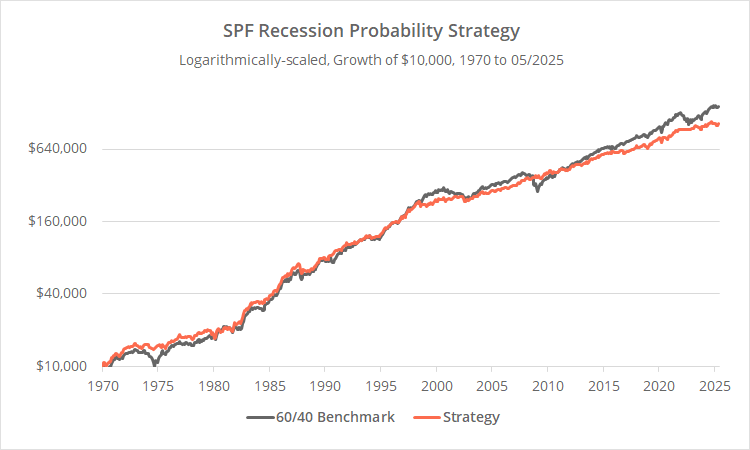
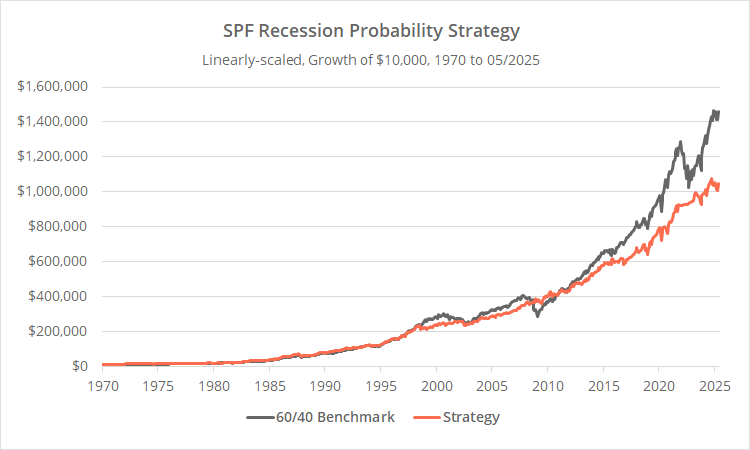
Logarithmically-scaled. Click for linearly-scaled results.
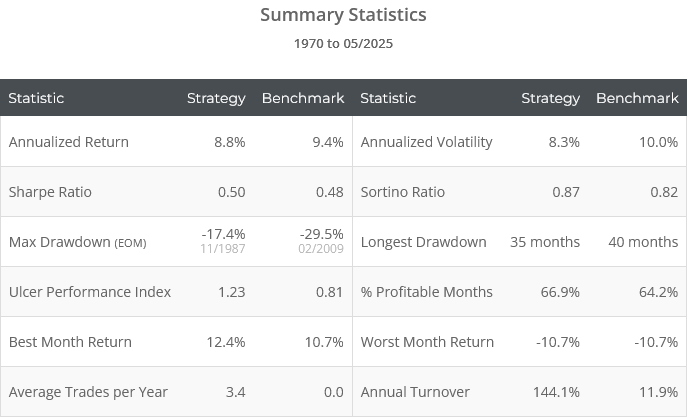
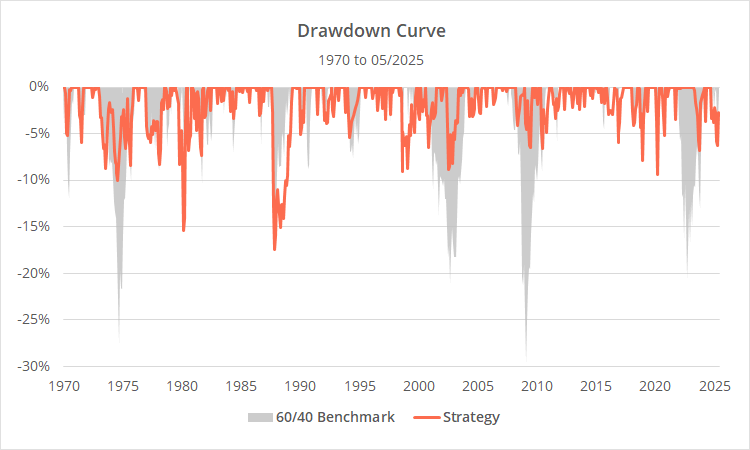
These results show that the strength of this strategy would not have been in generating big returns, but rather, in sidestepping significant market losses, while maintaining buy & hold like returns.
The strategy trades based entirely on quarterly data from the Survey of Professional Forecasters (SPF). The SPF asks economists to forecast future values for a broad range of macroeconomic data. This sets it apart from other strategies we track, which tend to be based on “hard data” like market prices and/or economic data.
An important note: We usually replicate strategies as closely as possible to the author’s original intent, within some basic platform-wide standards. In this case, we’ve made significant changes to Sun’s design. More on this later.
Strategy rules tested:
Survey of Professional Forecasters (SPF) results are assumed to be released in the 2nd month of each quarter (i.e. Q1 by the end of Feb, Q2 by the end of May, etc.).
-
At the close on the last trading day of months 2, 5, 8 and 11, calculate the average likelihood of recession from fields RECESS2, RECESS3 and RECESS4.These correspond to economists’ recession expectations for the following 1, 2 and 3 quarters.
-
Compare this to the average likelihood of recession last quarter in fields RECESS3, RECESS4 and RECESS5.These correspond to economists’ previous expectations for those same 3 quarters.
- If the average RECESS2..4 value from this quarter is less than or equal to the average RECESS3..5 value from last quarter, hold a 60/40 mix of US stocks (represented by SPY) and Treasuries/cash, otherwise move entirely to Treasuries/cash.
-
To determine whether we will hold Treasuries or cash, refer to the average expectation for 10-year Treasury yields in fields TBOND3, TBOND4 and TBOND5 (1).These correspond to economists’ expectations for yields in the following 1, 2 and 3 quarters.
-
Compare this to the average expectation for 10-year Treasury yields from last quarter in fields TBOND4, TBOND5 and TBOND6.These correspond to economists’ previous expectations for those same 3 quarters.
- If the average TBOND3..5 value from this quarter is less than or equal to the average TBOND4..6 value from last quarter, hold US Treasuries (IEF), otherwise move to cash.
- All positions are executed at the close on the last trading day of the month. Rebalance the portfolio monthly, even if there is no change in position.
Why we changed Sun’s original design:
As mentioned, we usually replicate strategies as closely as possible to the author’s original intent, but in this case, we’ve made significant changes to Sun’s design. This was due to (a) concerns about likely overfitting, and (b) the strategy’s overreliance on long duration Treasuries.
Sun’s current paper is actually the second iteration. The original version of his paper was based only on RECESS2 versus lagged RECESS3 values. This corresponds to economists’ recession expectations for next quarter, versus their previous expectations for that same quarter.
Logically, that idea makes sense.
We tested the original paper and found a major error. The author rewrote the paper, changing the strategy to use RECESS4 versus lagged RECESS5 values. This corresponds to economists’ expectations for 3 quarters hence, versus their previous expectations for that same quarter.
That makes much less sense logically. We strongly suspect that the author based the newest version of the strategy on whatever datapoints produced the best historical results, and that’s implicitly a recipe for overfitting. We think this general idea of using SPF survey data has value, so we’ve reinterpreted Sun’s strategy in the more robust way described earlier.
In addition, Sun’s strategy had no means to rotate out of long duration bonds, a cardinal sin in an era of rising interest rates.
So, we’ve applied Sun’s same approach to using SPF survey data to the bond position as well. This idea was wholly our own, but we think it matches the spirit of Sun’s strategy. It improved historical performance, especially in recent years as interest rates have risen.
Our take on this strategy:
Over the last 50+ years, SPF survey data would have consistently helped investors sidestep significant market drawdowns.
The two biggest exceptions were:
-
1980, due to rapidly rising interest rates.SPF hadn’t yet began producing TBOND survey results (see calculation note at the end of this article). That means that the strategy couldn’t avoid big losses in Treasuries, but likely would have if those survey results had been available.
- 1987, when the market fell too fast for the strategy’s quarterly cadence.
We think there’s value in these SPF survey results as an additional input to “hard data” strategies based on market prices or economic data. Is the specific way we’ve interpreted SPF survey results here the absolute best approach? Probably not, and we invite other developers to explore this unique data source for themselves.
At the very least, the strategy offers a novel view on the general state of the market.
New here?
We invite you to become a member for about a $1 a day, or take our platform for a test drive with a free membership. Put the industry’s best Tactical Asset Allocation strategies to the test, combine them into your own custom portfolio, and follow them in real-time. Learn more about what we do.

* * *
Calculation notes:
(1) TBOND survey results were used from Q1 1992 onwards. TBILL survey results were used from Q3 1981 to Q4 1991. Prior to Q3 1981 we assumed the strategy always held US Treasuries (IEF).
(2) The author assumed positions were executed on the 1st day of the new quarter, based on the previous 2 quarterly survey results. We’ve tightened that up, assuming execution at the end of the 2nd month of the current quarter. This slightly improved historical results, and helped offset some of the other changes we made to the strategy.