 We are often asked about stock market valuation models such as Shiller’s CAPE Ratio and the Buffett Indicator. These models predict long-term returns, usually forecasting the next 10 years.
Our recent analysis of one such valuation model, the Aggregate Investor Allocation to Equities, motivated us to take our our own deep dive into the subject. Our goal is two-fold: (a) analyze valuation models using a consistent, objective approach, and then (b) combine those models into an aggregate forecast, not unlike what we do for TAA.
Members (free and paid), begin exploring your new 10-Year Stock Market Return Forecast now.
There’s a ton of data to review. We cover 8 valuation models (with more to be added in the future), and perform both hindsight and walk-forward analyses, as well as create an aggregate forecast. We don’t want to bog this post down with math, but for those interested, learn about our methodology.
What does the analysis look like?
Below is some sample data for the AIAE indicator (which we also covered in our last blog post).
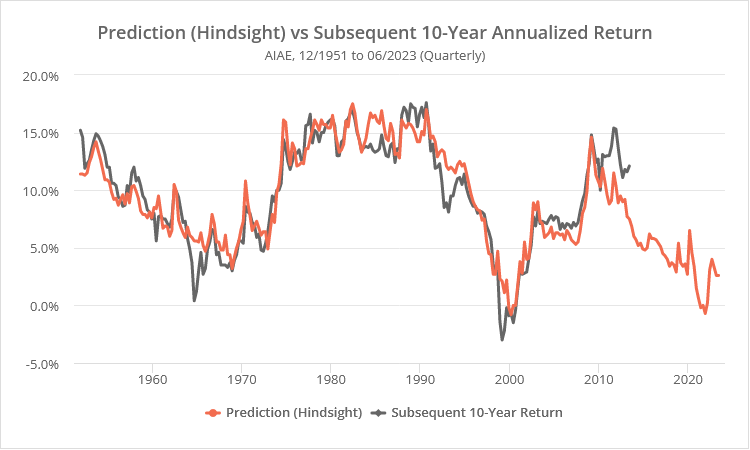
In the first graph below, we show “hindsight” predictions for each quarter since 12/1951 (orange), as well as the actual stock market return over the following 10 years (grey). Note how well the two lines track. The average error between prediction and actual return was just +/- 1.3%.
Note: The grey line doesn’t extend to the end of the chart because that 10-year period hasn’t finished yet.
Hindsight analysis (as in the graph above) is based on how we would have interpreted the data knowing everything we know today. This is the usual approach to judging valuation models.
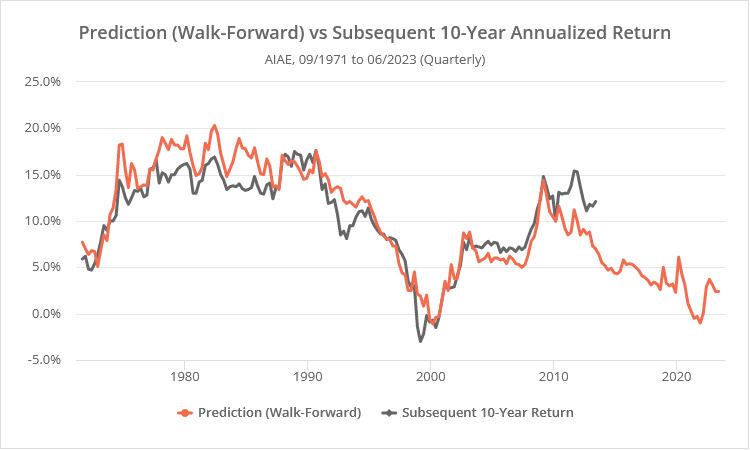
“Walking our analysis forward” is a better approach, based only on the data available at that moment in time, but provides less historical data to consider. In the next graph, we show walk-forward AIAE predictions for each quarter since 09/1971.
Why is walk-forward analysis better? If the key values that tell us the market is over or undervalued are only clear in hindsight, it gives us less confidence that those key values will still be relevant in the future. Conversely, if those key values have been clear throughout history, knowing only what we knew at that time, it gives us confidence that they will continue to be so.
Note how well the two lines track, even with this more rigorous test. The average error between predictions and actual returns was only slightly higher at +/- 1.9%.
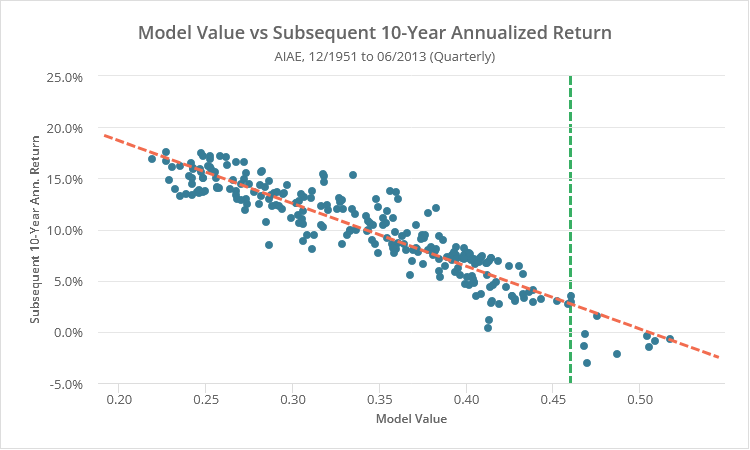
We also provide additional data, such as the scatterplot below. Here we show raw AIAE values (X axis) and the subsequent 10-year stock market return (Y axis). The orange line is a simple linear regression (R2 = 0.86), and the green line is the most recent AIAE value.
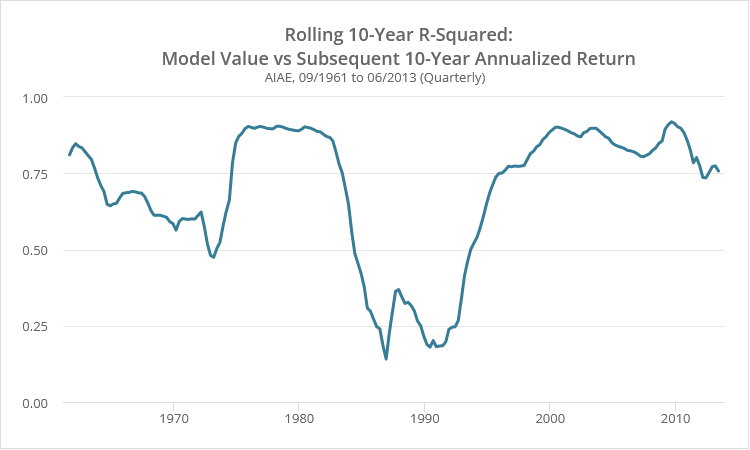
We also show how the effectiveness of the valuation model has changed over time. Below we show a rolling R2 value between model value and subsequent 10-year stock market return. Higher values indicate the valuation model was more predictive of returns over that 10-year period.
We then combine these individual valuation models together into an aggregate forecast like the following:
Members (free and paid), begin exploring the rest of the 10-Year Stock Market Return Forecast now.
How are these long-term forecasts useful?
As shown in our last blog post, unlike the Tactical Asset Allocation strategies we track, these valuation models have not been useful (at all) for agile, short-term trading.
Even if you could predict with perfect foresight the market’s returns over the next 10 years, there could be major bear and bull markets along the way, and these valuation models are not going to do anything to help you navigate them.
However, an accurate long-term forecast would be useful for investments that are, by choice or by circumstance, longer-term (10+ years) in nature.
Why you should be skeptical of these long-term forecasts:
Here’s our overarching conclusion:
Yes, the historical track record of some of these valuation models has been impressive. The best of the bunch have been AIAE, Tobin’s Q Ratio, and our aggregate forecast based on multiple models.
Having said that, these valuation models are still too imprecise to rely on 100% for real-world decision making. Getting your risk posture wildly wrong for a month (as could be the case with Tactical Asset Allocation) is painful. Getting your risk posture wrong for a decade is life altering.
We think that these models have value, but we would strongly caution against completely basing an investment plan on them. Treat this as an interesting data point supported by historical data. Could it, after a careful review of the data, influence an investor’s B&H risk posture? Sure. Would we recommend making an aggressive decision like going all in or all out based on it? Absolutely not.
What these valuation models are forecasting for the next 10 years:
As of the time we’re writing this…
- Individual valuation model predictions for the next 10 years range from -6.2% to 8.1% (annually, walk-forward).
- The two standout models, AIAE and Tobin’s Q Ratio, are predicting a similar 2.4% and 3.6% respectively.
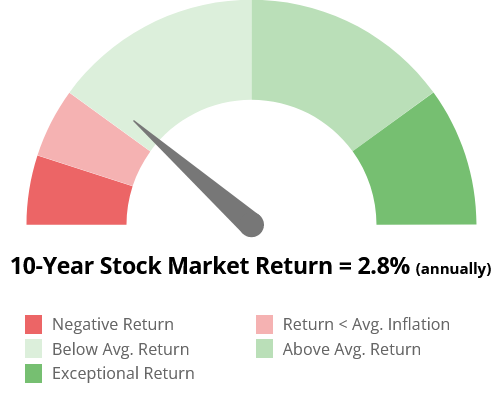
- Our aggregate model is forecasting 2.8%. We also provide an aggregate forecast for the 60/40 benchmark of 3.3%. Both forecasts are a tad over average historical inflation, but far below historical norms.
Members (free and paid), begin exploring your new 10-Year Stock Market Return Forecast now.
New here?
We invite you to become a member for about a $1 a day, or take our platform for a test drive with a free membership. Put the industry’s best Tactical Asset Allocation strategies to the test, combine them into your own custom portfolio, and follow them in real-time. Learn more about what we do.
