We rolled out two awesome new features for members over the weekend:
- Strategy Categories
- Model Portfolio Historical Allocation Analysis
Strategy Categories
The list of tactical asset allocation strategies that we track is growing long (33 and counting). That’s a good thing; we want members to have access to as large a toolbox as possible. But understanding how all those strategies stack up against one another can be overwhelming.
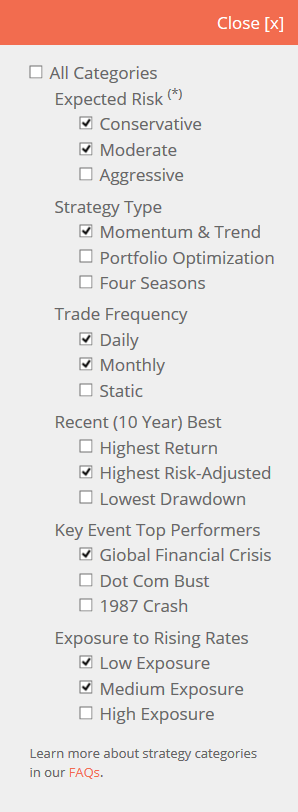
Part of the solution is the Strategy Screener that we introduced last year, which allows members to see how strategies compare based on backtested statistics (Sharpe Ratio, etc). But there are other factors those conventional stats might not capture, so we’ve added the ability to also filter strategies by category (see image to the right).
We’ve tried to choose both quantitative and qualitative categories that go beyond what a traditional backtest can tell us.
So for example, out of the list of 33 TAA strategies, if I were to filter by (a) conservative or moderate strategies, (b) based on momentum/trend-following, (c) that trade daily or monthly, (d) that have been a top risk-adjusted performer over the last decade, (e) a top performer during the Global Financial Crisis, (f) with low to medium exposure to rising interest rates, I would be left with just two strategies: Keuning & Keller’s Generalized Protective Momentum, and US Risk Parity Trend-Following. I could then focus more of my efforts on those two particular models.
This is a work in progress, and we plan to add more categories in the near future. As always, feature development at Allocate Smartly is almost entirely driven by member feedback, so we’d love to hear from you. If there are categories that you’d like to see added, please don’t hesitate to reach out.
Model Portfolio Historical Allocation
Last month we added Historical Allocation Analysis to all of our strategy backtests. This powerful feature breaks down each strategy’s historical allocation decisions to help members better understand how the strategy responded to various market conditions.
We’ve now added this same feature to members’ custom model portfolios (members, go there now).
For the uninitiated, a custom model portfolio allows members to combine strategies in whatever proportion they choose, backtest the portfolio’s historical performance and track the portfolio in near real-time. This new feature adds an additional layer of analysis, showing the portfolio’s combined asset allocation decisions that led to its performance.
What’s coming next?
 The two biggest new features on the horizon in the near term are:
- Multiple custom model portfolios. Many members have requested the ability to maintain multiple model portfolios. This could be, for example, because they’d like to choose low turnover strategies for taxable accounts, and more dynamic high turnover strategies for their non-taxable accounts.
- Rolling statistics (ex. a rolling 10-year Sharpe Ratio). Summary statistics are useful, but not as useful as being able to see how summary statistics change over time.
Expect to see both in the coming months.
We invite you to become a member for less than $1 a day, or take our platform for a test drive with a free limited membership. Track the industry’s best tactical asset allocation strategies in near real-time, and combine them into custom portfolios. Have questions? Learn more about what we do, check out our FAQs or contact us.
