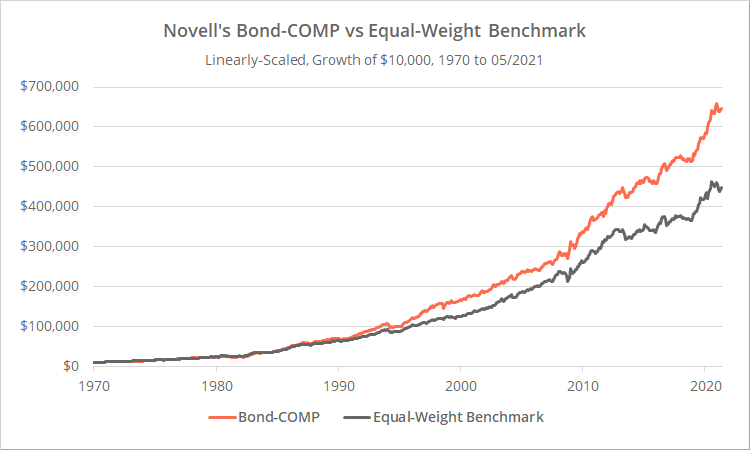
This is a test of a tactical bond strategy from Paul Novell of Investing for a Living. It rotates between credit bond ETFs and defensive assets based on the same rules as his popular SPY-COMP strategy.
Backtested results from 1970 follow. Results are net of transaction costs – see backtest assumptions. Learn about what we do and follow 60+ asset allocation strategies like this one in near real-time.

Linearly-scaled. Click for logarithmically-scaled chart.
Note: We usually benchmark to the ubiquitous 60/40 but given the fact that this is a bond ETF strategy (and not a more general portfolio strategy), we’ve benchmarked to an equal-weight portfolio of the underlying assets.
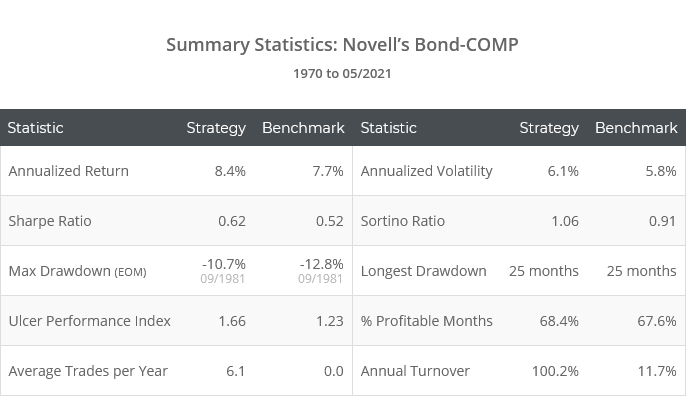
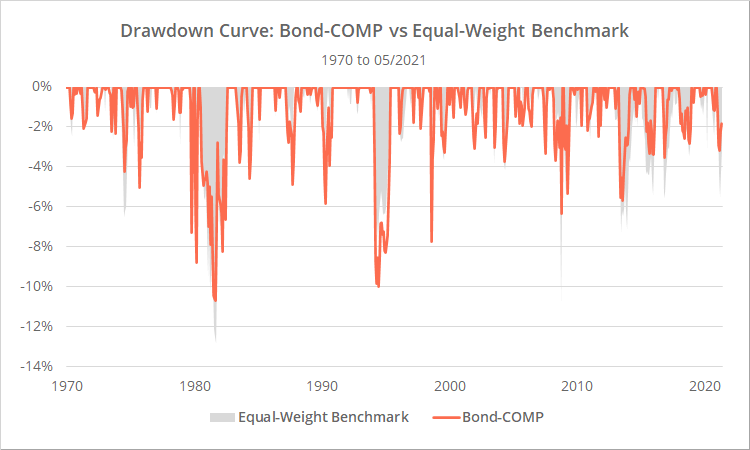
As these results illustrate, Bond-COMP has improved the performance of the underlying assets, but the overall ebb and flow in results has still been highly dependent on underlying asset performance. For example, when the underlying assets have experienced large drawdowns, Bond-COMP has been able to reduce their severity, but not avoid them altogether.
Paul Novell filled a role similar to Allocate Smartly long before our site was a twinkle in the eye. Paul cataloged and tracked a number of Tactical Asset Allocation strategies, many of which you’ll find on our site today. He has since turned that duty over to the pros, and remains one of our biggest supporters. We highly recommend you follow him now.
About this strategy:
We won’t be covering Bond-COMP in much depth because we already discussed the basic ruleset when we covered SPY-COMP. We would encourage interested readers to check out that article.
The basic premise of Paul’s strategy is thus:
Trend-following based on asset price alone does a good job determining when to switch to defensive assets inside of recessions, but a poor job outside of recessions. Outside of recessions, any deviation from 100% long risk is often a drag on performance, making attempts to finesse positions via trend-following counterproductive. If we have a means to judge when the economy is entering/exiting a recessionary period, we’ll know when to turn trend-following on/off.
Bond-COMP uses the same rules as SPY-COMP based on the same 6 economic indicators, but instead of switching between US equities (SPY) and treasuries (IEF), it switches between an equal-weight portfolio of mostly credit bond ETFs when risk on and gold/treasuries when risk off.
- Risk on portfolio: US high-yield bonds (HYG), US corporate bonds (LQD), international aggregate bonds (BNDX) and emerging market bonds (EMB)
- Risk off portfolio: intermediate-term US Treasuries (IEF), long-term US Treasuries (TLT), gold (GLD) and cash/short-term US Treasuries
Generally, Bond-COMP should be expected to provide a less volatile ride than SPY-COMP due to the nature of holding a basket of bond assets. However, members should not be fooled by the fact that these are bonds into thinking that risk is nil. Some of these assets, especially HYG and EMB can be quite equity-like during periods of market stress.
Our take on Bond-COMP (and SPY-COMP):
We are proponents of this idea of mixing economic data and price analysis. We think that there’s truth in the “effectiveness of trend-following inside vs outside of recessions” observation, and at the very least, it helps to diversify conventional trend-following/momentum strategies.
Having said that, we would be wary of allocating our entire portfolio to these types of strategies, as economic analysis can be slow to respond to economic crises, especially when they come on suddenly as we saw during last year’s Covid melt down/melt up. Side note: both Bond-COMP and SPY-COMP played it well, turning in strong returns for the year, but every economic crisis is unique.
The solution is simple though: diversify these types of strategies with more conventional price-based strategies (something our site was specifically built to tackle). Members: for a list of other strategies that use economic analysis, use the “Filter by Category” feature at the top of the All Strategies list.
As far as Bond-COMP vs SPY-COMP? We don’t have a strong opinion. There are key differences between the two that may make one or the other more attractive, and we encourage members to check out the various reports we provide in the members area. Some highlights:
- Obviously, SPY-COMP has been the much more volatile/risky/high returning of the two, but in terms of risk-adjusted performance, they’ve performed similarly
- The risk on assets traded by Bond-COMP are mostly credit bonds, so while the Exposure to Rising Interest Rates report shows more interest rate exposure than SPY-COMP, it’s not the egregious levels you might expect from a bond trading strategy.
- The majority of SPY-COMP’s profits have come from capital gains (86%), while the majority of Bond-COMP’s have come from dividends (63%). We’re agnostic to the two except as it affects tax efficiency, but some investors have a preference for dividends.
How we handle upgrades to existing strategies:
Bond-COMP is an upgraded version of another Novell strategy we track: Bond UI1 (member link).
Strategy developers of the snake oil variety will often release upgraded versions of strategies in response to strategy failures. Of course, those aren’t really upgrades, they’re simply some overfit rule to respond to that one particular failure with dubious application to the future.
It’s clear from following Paul’s work that this upgrade is not that. Bond UI1 never failed, and Bond-COMP is obviously an evolution in his thinking. That’s a natural result of a developer continuing to improve their work and should be encouraged.
But how should we handle these upgrades on our platform?
- First, we won’t modify/overwrite an existing strategy. Members have already combined strategies into their Model Portfolios, and we wouldn’t want to stomp the analysis they’ve previously done. Both Bond UI1 and Bond-COMP will continue to live on our platform.
- For members who have Bond UI1 in their portfolios, we recommend taking a look at Bond-COMP and determining if it’s worth replacing that exposure.
-
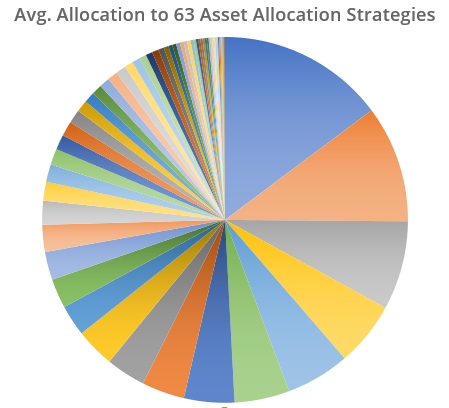
We track a lot of strategies (60+ at the moment) and we’re wary of overwhelming members with too many choices. In the graph below we’ve shown the average member allocation (via their Model Portfolios) to each of the strategies that we track.It roughly follows the 80-20 rule, with the vast majority of attention given to a relatively small number of top performers. That means that there’s a big set of really unpopular strategies. The bottom 12 account for just 1% of member allocation. At some point in the future, we may cull these unloved strategies (with plenty of warning of course), and deprecated strategies like UI1 could be removed at that point.
Thank you to Paul Novell and the opportunity to put Bond-COMP to the test. For readers interested in all things asset allocation, we highly recommend following Paul’s Investing for a Living now.
New here?
We invite you to become a member for about a $1 a day, or take our platform for a test drive with a free limited membership. Put the industry’s best tactical asset allocation strategies to the test, combine them into your own custom portfolio, and follow them in near real-time. Not a DIY investor? There’s also a managed solution. Learn more about what we do.


