As readers hear us repeat often, our results tend to be less optimistic than you’ll find elsewhere. We do our best to show backtested results that are as realistic as possible (even though showing results that are as good as possible would probably be better for business).
That’s partially a result of simple things, like accounting for transaction costs + slippage of 0.1% per trade (or roughly $10 on a $10,000 trade). This modest assumption would result in up to a ~2.4% per year drag on returns for a portfolio that’s turned over once per month. Very often though, our less optimistic results simply come down to using better historical data to simulate ETFs prior to their launch. In this post I’m going to demonstrate that with US small-cap value, but this same case could be made with many other asset classes as well.
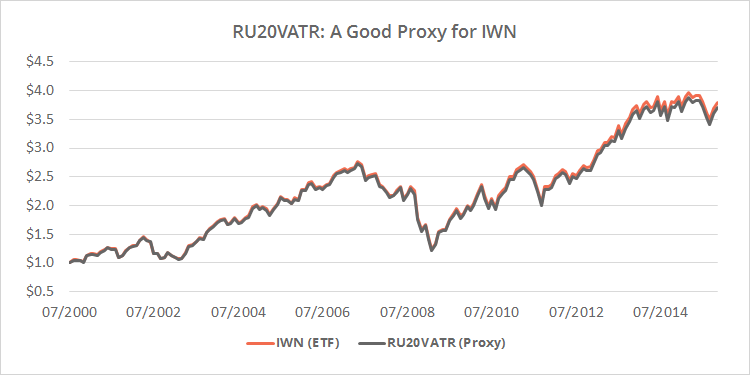
Below I’ve shown the ETF IWN (small-cap value), versus our proxy for IWN prior to its launch: the Russell 2000 Total Return Value Index (Bloomberg ticker: RU20VATR), with the appropriate expense ratio applied, from mid-2000 to 11/2015.
RU20VATR has been a good match given the longer-term nature of the strategies that we cover. IWN returned 9.1% annualized over this period, versus 8.9% for our proxy RU20VATR.
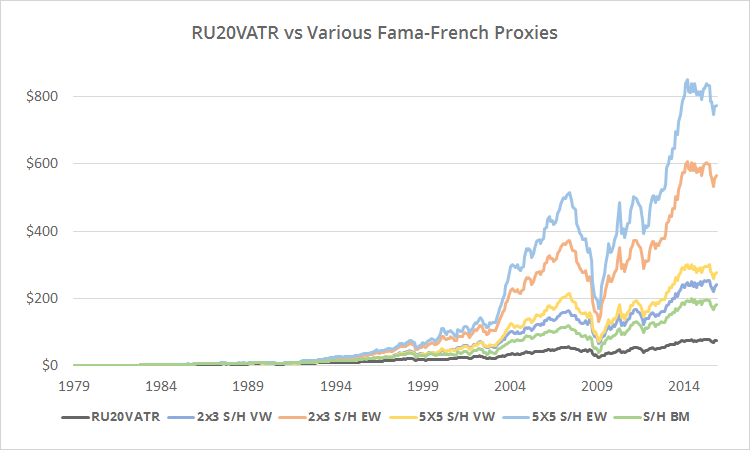
Next I show our proxy RU20VATR, versus multiple commonly used Fama-French proxies, from 1979 to 11/2015. The results have been less impressive.

Linearly-scaled to emphasize differences. Click for logarithmically-scaled chart.
Clearly, this Fama-French data does not make for an accurate proxy. Returns range from 15.2% to 19.8% annualized, versus just 12.5% for RU20VATR. Attempting to use these to represent small-cap value returns would likely lead to highly unrealistic results.
I’m picking on this particular asset class to prove a point, but the same conclusion applies to a number of asset classes where Fama-French, Ibbotson, poorly matched mutual fund, etc. data is used. In many cases, that data does not remotely match up to anything that can be traded in today’s market.
I realize that this flies in the face of a lot of work that’s been done to date, and trust me, we’re not trying to ruffle any feathers. We’re just trying to shine the light on an issue that tends to work its way into TAA backtests. Because of the slower-moving nature of TAA, we researchers try to extend backtests as far back in history as possible, and are willing to accept less accurate data in order to do so. I think this is an important and necessary balancing act, but in my view, one that sometimes goes a bit too far.
—
Further thoughts:
- I focused on one particular ETF (IWN) because that’s the small-cap value ETF used throughout this site, but the same basic conclusion would have held for other ETFs as well (ex. VBR or IJS).
- There are some cases where Fama-French, Ibbotson, mutual funds, etc. do make for good proxies. For example, VFINX is a good proxy for SPY (in the timeframe TAA trades in), and Fama-French benchmarks are a reasonably good proxy for large-cap momentum.
- Researchers sometimes combine or otherwise manipulate Fama-French et al. data to try to make them fit a given asset. That could certainly improve fit, but I would be skeptical until I had seen evidence of such.
- The purpose of this post isn’t to say that these return streams can’t be accessed in some way, such as with individual stocks minus (potentially substantial) expenses. This is only to say that these return streams are often not easily accessible to investors via ETFs, mutual funds, etc.
- The purpose of this post also isn’t to say that these data sources aren’t useful for research of “this-vs-that” such as value vs growth or small vs large cap, only that a backtest of a finished strategy based on these data sources will likely be far too optimistic.
