We just released version 3.0 of our Portfolio Optimizer for Pro members and it’s awesome.
New here? We track Tactical Asset Allocation strategies. Members can combine those strategies together into what we call “Model Portfolios”. The Portfolio Optimizer shows the optimal mix of strategies to trade in your Model Portfolios based on objectives like maximizing the Sharpe Ratio or minimizing volatility.
Note that this feature is for Pro members only. You can upgrade at any time at a very reasonable price by visiting your account and clicking “Change Plan” (all legacy pricing is still honored).
Version 2.0 was great, but had a major shortcoming:
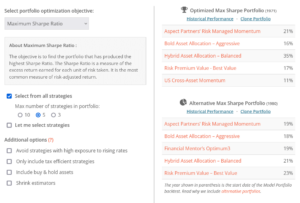
Our previous version 2.0 of the Portfolio Optimizer (click on the image to the right to zoom) combed through all 80+ strategies we track to find the mix of 3-10 strategies that would have performed best based on the member’s investment objective.
Users could further refine the final portfolio using criteria like only including tax-efficient strategies or avoiding strategies with high exposure to rising interest rates. Non-pro users will still enjoy these version 2.0 results.
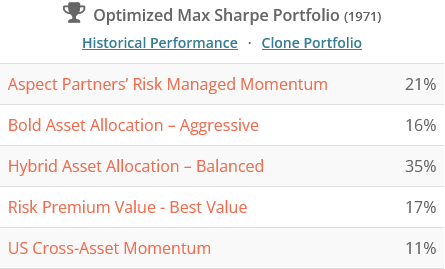
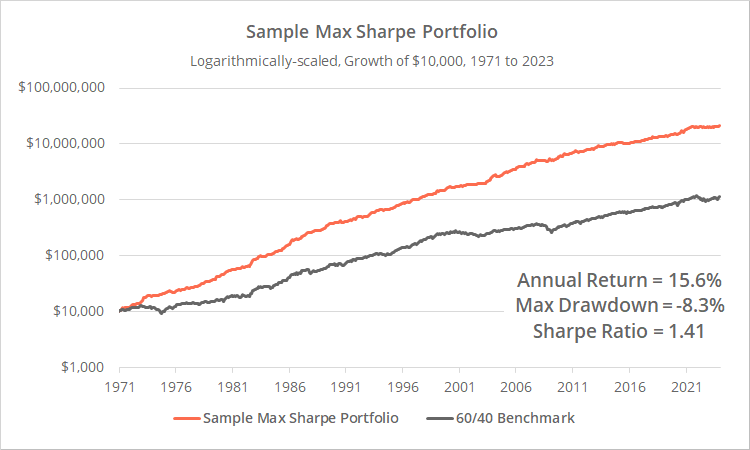
Here’s a sample portfolio, optimized for the maximum Sharpe Ratio:
This portfolio would have crushed it historically, producing 15.6% annually and a Sharpe Ratio of 1.41, without ever suffering a drawdown more than -8.3%. That’s some smooth sailing.
But what if you, after drawing upon all of the advanced analysis of our platform, decided you didn’t like one or more of those strategies? We can’t eat backtested returns, so it’s important that members are confident in the strategies traded, regardless of what the historical results say.
Maybe you don’t like the fact that Aspect Partner’s RMM is a proprietary strategy, meaning you can’t analyze the rules. Or maybe you read our analysis of Bold Asset Allocation and agreed with our concerns about the strategy’s design.
If you were to remove either of those strategies, it would have a knock-on effect across the remaining portfolio. To achieve a high Sharpe Ratio, the portfolio must be a cohesive unit, with each strategy traded in the correct proportion. Strategy X must zig when strategy Y zags to produce that smooth performance.
Enter Version 3.0: Custom Optimized Model Portfolios
Pro members can now select the pool of strategies (up to 10) that the Optimizer draws from to find the optimal portfolio. Let’s look at a use case by replacing the two strategies in the example above.
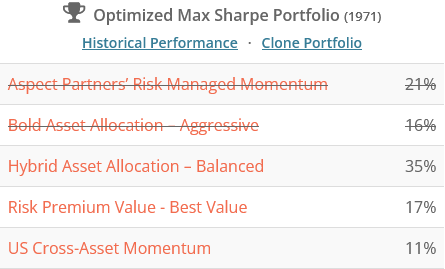
Again, here’s our starting portfolio. We want to replace the two struck-through strategies.
To be clear: we’re describing a hypothetical use case here and not actually passing judgement on any of the strategies mentioned. Forge your own path.
We begin by referring to the Correlation Matrix and filtering on the two strategies we want to replace (RMM and BAA). We see two new strategies with a reasonably high correlation to both that might make for good replacements: Vigilant Asset Allocation (VAA) – Balanced and VAA – Aggressive. We decide we like both of those new strategies.
How do we integrate these new strategies? How will it affect the optimal allocation to all strategies?
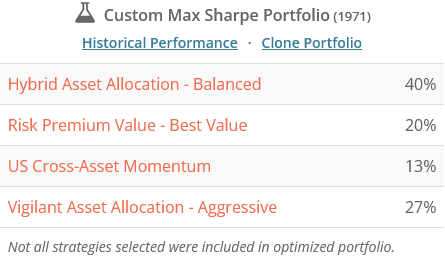
We return to the Portfolio Optimizer, select Max Sharpe, and then select 5 strategies: the 3 strategies from our original portfolio, plus the two variations of VAA. Here are the results:
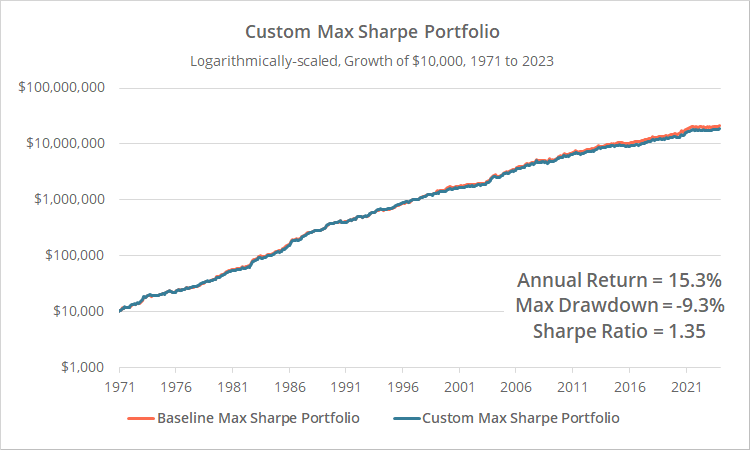
Yes, there are two equity curves here. The orange line is our initial version 2.0 portfolio. The blue line is our customized version 3.0 portfolio. The equity curves are nearly overlapping and the performance stats are almost identical. In terms of historical performance, these are essentially the same portfolio.
The difference is that we’re now trading strategies we feel confident are more likely to meet expectations in the future.
Calculation note: Why is only VAA-Aggressive (and not VAA-Balanced) included? The Optimizer determined that was the strategy mix that maximized the Sharpe Ratio. The member sets the starting pool of strategies, but some may not make the final cut.
Power user details:
We’ve tried to make something very complex feel very simple in terms of the user experience, but there are some details that power users (of which we have many) should be aware of.
A. Optimized to the expected portfolio start date.
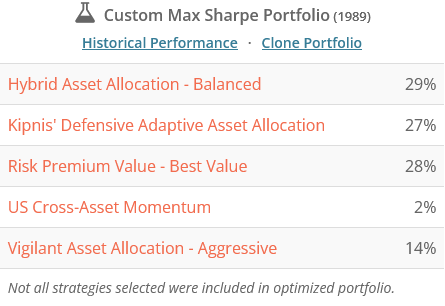
Let’s return to our previous use case. Let’s say in addition to the 3 strategies from our original portfolio, plus VAA-Balanced and VAA-Aggressive, we added a sixth strategy: Kipnis’ Defensive Adaptive (KDA). In this hypothetical, we’ve selected KDA because we like the strategy and it also exhibits a reasonably high correlation to the two strategies we want to replace.
Here’s our new optimized portfolio:
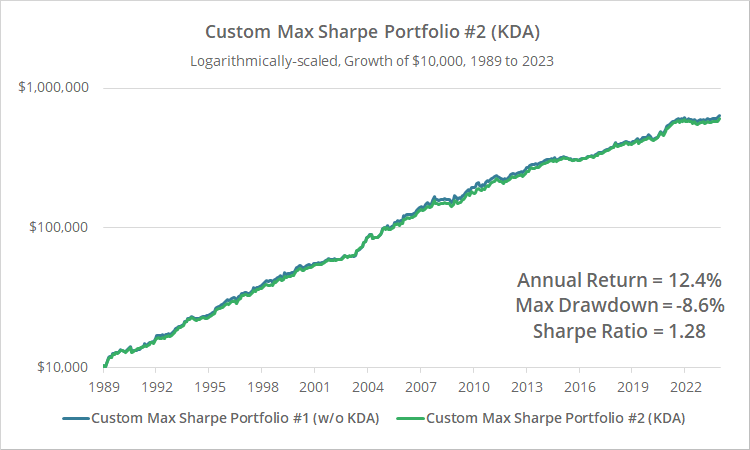
The Sharpe Ratio decreased from 1.35 to 1.28. Still a strong performance, but why would adding another strategy cause a worse Sharpe Ratio?
The answer: the two Model Portfolio backtests cover different periods of time. The first (Sharpe = 1.35) starts in 1971, the second (Sharpe = 1.28) starts in 1989. We optimize to the period of time shared by all strategies selected. Our backtest of KDA is particularly short (starting in 1989), and the Optimizer is finding the best performing combination over that shorter period.
The portfolio mix in our first optimization (that excluded KDA) would have performed worse over the shorter period of time covered by our second optimization (that included KDA), with a Sharpe Ratio of 1.24 (w/o KDA) versus 1.28 (w/ KDA).
Which optimized portfolio is better? That depends. Do you value KDA enough to include it even though the backtest will be shorter? Or do you value having a longer backtest? There is no right or wrong answer.
A statistic, be it Sharpe Ratio or Sortino Ratio or variance, can’t be viewed in isolation. It must be viewed relative to the specific period of time being measured.
B. Portfolio constraints.
By default, we apply a commonsense limit on the maximum allocation to each strategy based on the number of strategies selected. For 3 strategy portfolios, that limit is 50%. For 4+ strategies, it’s (2/n) where n = the number of strategies selected.
Let’s return to our first custom optimization (the one that did not include KDA).
Even though only 4 strategies made it into the final portfolio, there is an allocation limit of 40% based on the original 5 strategies selected (2/5 = 40%). Hybrid Asset Allocation bumped up against that limit and was capped at 40%.
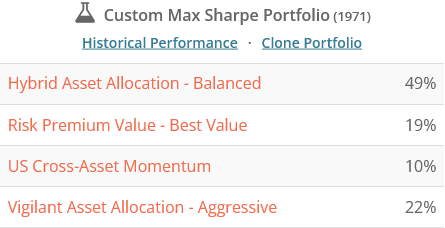
If a member wanted to reoptimize with the 4 strategy limit of 50% (2/4), they could select just those 4 strategies to produce the following slightly different portfolio (which has still been about equally as effective historically):
Note how HAA’s allocation scaled up from 40% to 49% and everything else scaled down to compensate,
We also provide the ability to remove portfolio constraints altogether. That means a single strategy could be allocated 100% of the portfolio.
A word of caution: we were torn on whether to add unconstrained optimizations. Regardless of what might have performed optimally in the past, common sense should always prevail, and investors should always employ a reasonable degree of cautious diversification. We highly encourage members to use unconstrained optimizations with care.
The Portfolio Optimizer should be treated as a starting point:
An overriding theme that I hope all of our work conveys is that investors should look beyond backtested results. We can’t eat backtested returns. All that matters is how we perform, in the real-world, from this day forward.
That means doing our best to judge how strategies are likely to perform in the future, and then leaving ourselves some wiggle room in case things don’t turn out as we expect. How do we gauge how strategies are likely to perform in the future?
Sometimes it’s black-and-white. If I’m trading in a taxable account, selecting strategies that we know have been very tax inefficient is probably suboptimal.
Sometimes it’s more gray, like limiting exposure to strategies with high exposure to rising interest rates. That’s obvious now that we’ve lived through the simultaneous implosion of stocks and bonds in 2022, but it was a more nebulous concept prior.
We try to call out these less obvious issues when we cover strategies on our blog. Readers will note that we’ve become much more adversarial in our coverage of new strategies in the last couple of years. Expect that to continue.
The point of all of that is to say that these optimized portfolios, be they prebuilt version 2.0 or custom version 3.0, should be treated as a starting point – another tool in the investor’s toolbox – not a spoon-fed solution that should be accepted without question.
New here?
We invite you to become a member for about a $1 a day, or take our platform for a test drive with a free membership. Put the industry’s best Tactical Asset Allocation strategies to the test, combine them into your own custom portfolio, and follow them in real-time. Learn more about what we do.
