As a whole, Tactical Asset Allocation (TAA) did not manage losses during the 2022 bear market as well as it has during previous downturns. Individual strategies varied and some did well, but a primary function of TAA is loss management, and any failure to do so is worth analyzing further.
In this post, we’re going to break down the reason for some strategies’ poor performance in 2022. Here’s the short version:
- In terms of the switch from an offensive (risk on) to a defensive (risk off) risk posture, TAA did as well as it has historically. In that sense, TAA did what it’s designed to do.
- The problem came with the choice of assets some strategies used to express that defensive posture: bonds, mostly in the form of long-duration US Treasuries (ex. IEF and TLT).
- Bonds failed to offset risk asset losses to a degree not seen in nearly 100 years. We assume that the affected strategies either didn’t foresee the possibility of risk assets and bonds imploding simultaneously or considered the risk too remote to account for.
We’ll walk through each of these points individually, and then show how our platform helps to minimize future exposure to this risk.
1. Tactical Asset Allocation (TAA) did not perform as well during the 2022 bear market as previous downturns:
Throughout this post, we’ll be analyzing TAA’s performance based on the aggregate allocation across all 70+ strategies we track. Because we track so many tactical strategies, these results are broadly representative of TAA as a trading style. See the end notes for more details about our methodology.
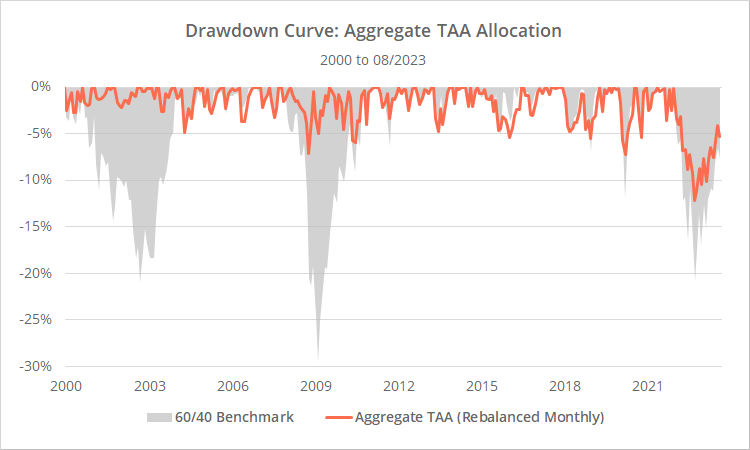
First, let’s look at TAA’s aggregate month-end drawdown from 2000 to the present, compared to the 60/40 benchmark. There were three significant market drawdowns over that period, two that TAA sidestepped near perfectly (2000-02 and 2007-08), plus our most recent in 2022.
The key takeaway from this graph is that TAA’s max drawdown in 2022 (-12.1%) was significantly worse than in either 2000-02 (-2.8%) or 2007-08 (-7.1%) and the drawdown has lasted longer.
Note: It’s a little unfair to compare TAA in 2022 to TAA during the 2000 and 2007 bear markets. TAA did especially well in the 2000/2007 bears relative to other market downturns in the more distant past (read more). We’re comparing to more recent history to keep this post easy to understand, but know that if we had included other more distant bear markets, the difference in performance wouldn’t be so stark.
2. In terms of the switch from an offensive to a defensive risk posture, TAA did as well as it has historically:
TAA’s issue was not in timing the switch from offensive to defensive assets, it was the specific defensive assets selected.
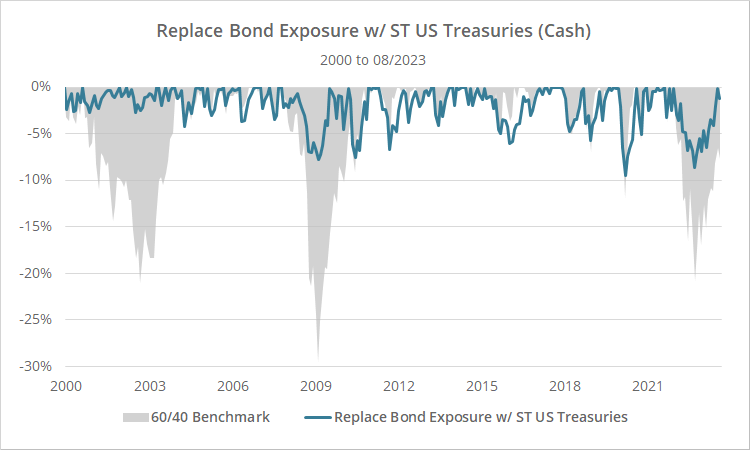
To illustrate, below we’ve shown a revised drawdown curve, but in this case, we’ve assumed that all exposure to bonds (US and intl. treasuries + US and intl. non-gov bonds) was instead allocated to US T-Bills (ETF: BIL), which do not bear the same interest rate risk as longer duration instruments.
When viewed from this perspective, the 2022 drawdown was very much in line with previous market downturns.
TAA is never going to perfectly call the market top and prevent 100% of drawdowns (and neither is any other strategy). Some degree of “wait and see” is required, otherwise the strategy will get whipsawed to death responding to every zig and zag of the market.
In terms of timing the move to a defensive posture, TAA did about as well as it has historically.
3. Bonds failed to offset risk asset losses to a degree not seen in nearly 100 years:
Note: For simplicity, we focused on one flavor of US Treasuries here, but we covered other UST durations and other alternatives like corporate bonds and TIPS in this post. The conclusion is essentially the same.
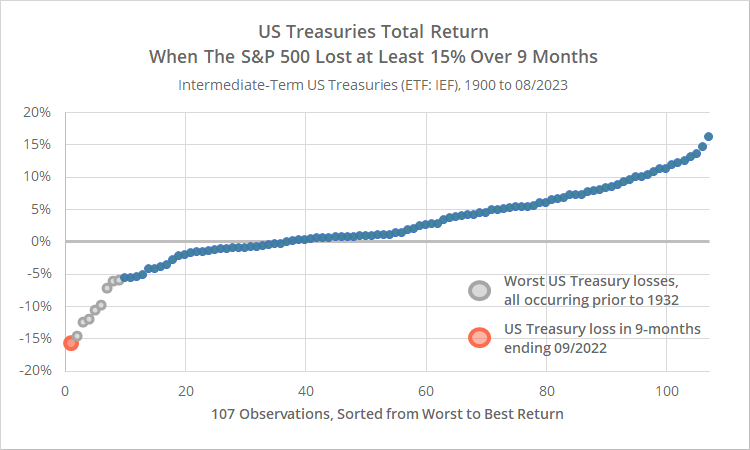
Bonds are usually a reliable diversifier during market downturns. But in 2022, both bonds and risk assets imploded simultaneously. In the first 9 months of 2022 the S&P 500 lost -23.9% (based on month-end values, adjusted for dividends). Over that same period, US Treasuries (IEF) lost -15.6%.
In the graph below we show how uncommon such a simultaneous loss has been. Here we’ve shown US Treasury returns in all 9-month periods when the S&P 500 lost at least -15% (expanding the definition of a market downturn) since 1900.
That orange dot represents the 9-months ending 09/2022. It was the worst concurrent loss in US Treasuries in over 120 years.
The next eight grey dots all occurred between 1907 and 1931. One could argue that they should have served as a warning that this degree of simultaneous loss was possible.
We suspect that, given the difficulty of estimating asset class data so far back into the past, some developers simply hadn’t considered it in their strategy design, or saw it as the distant past with no relevance to today’s market.
Speaking for ourselves personally and our own trading, we underestimated the probability of this magnitude of simultaneous loss in risk assets/bonds in today’s market and were overly allocated to bonds during the downturn.
4. Managing exposure to this risk of concurrent loss:
As mentioned, some strategies weathered the 2022 bear market well, others not so much. The main difference between those two groups was how they treat defensive asset exposure.
When some strategies detect weakness in the market, they blindly dump the portfolio into bonds (on the premise that bonds are a reliable diversifier during periods of market weakness). These strategies tended to fare poorly in 2022.
Other strategies treat defensive assets just like they do offensive assets; for example, by requiring defensive assets to exhibit positive momentum (otherwise dumping to a safe asset like cash). These strategies tended to fare much better in 2022.
We attempt to capture how susceptible each strategy is to rising interest rates in this member report. We consider not only the strategy’s historical exposure to rate sensitive assets, but also the characteristic we’ve described here: how the strategy treats defensive assets.
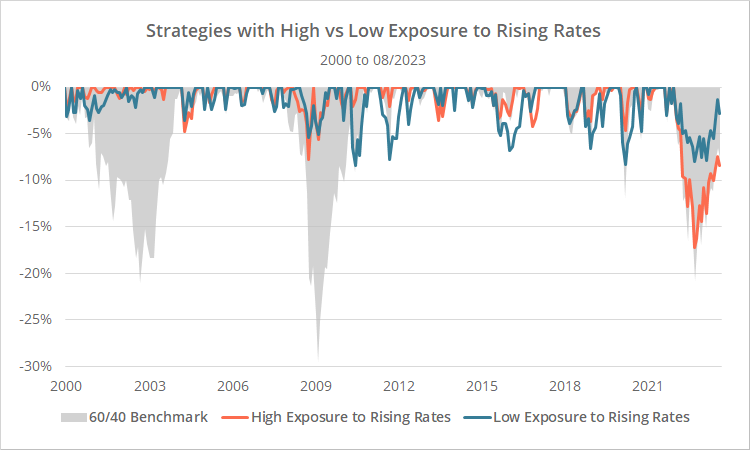
Below we’ve shown two drawdown curves. We sorted all strategies by their exposure to rising interest rates (based on the report linked above). The blue line shows the bottom tertile (one-third) of strategies, and the orange line the top tertile.
Strategies with low exposure to rising rates did much better minimizing max drawdown in 2022 (-8.0%) versus strategies with higher exposure to rising rates (-17.3%).
In short, one way users can minimize exposure to this risk of concurrent losses in risk assets and bonds is by limiting exposure to strategies that are especially at risk from rising interest rates.
We take this metric a step further by including it as an option in the Portfolio Optimizer, where we create optimized portfolios based on objectives like maximizing the Sharpe Ratio or minimizing portfolio variance. When selecting the option to “avoid strategies with high exposure to rising rates”, the optimizer will do just that: create a portfolio with limited exposure to these types of strategies.
To recap:
- Tactical Asset Allocation (TAA) did not manage losses in the 2022 bear market as well as it has during previous downturns.
- TAA timed the switch from an offensive to a defensive posture as well as it has in the past. The problem came with the specific asset classes that many strategies used to express that defensive posture: bonds, mostly in the form of long-duration US Treasuries (ex. IEF and TLT).
- Bonds failed to offset risk asset losses to a degree not seen in nearly 100 years.
- That’s not an excuse. Bonds are an integral part of portfolio management, but strategies shouldn’t assume that they will always protect against losses in risk assets.
- Our platform provides ways to limit exposure to this risk of concurrent losses in risk assets and bonds.
New here?
We invite you to become a member for about a $1 a day, or take our platform for a test drive with a free membership. Put the industry’s best Tactical Asset Allocation strategies to the test, combine them into your own custom portfolio, and follow them in real-time. Learn more about what we do.
* * *
Methodology:
- To analyze the aggregate performance of strategies, we used the same data provided to members in the Aggregate Allocation report. For simplicity’s sake we used the “Asset Categories” tab (representing each category with a single representative asset as described in this post). We also ran this analysis using the results from the individual assets tab and found very similar results to those presented here (which is unsurprising).
- We assumed execution was at the same market close as the aggregate allocation date, matching how most users are executing strategies on the platform (trading monthly at month-end). We performed alternative tests using daily data w/ no lag, daily data w/ a 1-day lag, monthly data w/ a 1-day lag, and found very similar results to those presented here (which is also unsurprising).
- Unlike most of the analysis on this site, we ignored transaction costs in calculating the performance of both TAA and the 60/40 benchmark. We did this in order to drill down on just the impact of changes in aggregate asset allocation.
- The source material for 3 strategies we track (out of the 72 included in this analysis) was published after the key 09/2022 max drawdown. In hindsight, those 3 strategies should have been excluded from this analysis (to limit hindsight bias). After reviewing the 3 strategies, we deemed only 1 to unfairly skew the results presented here (HAA), but its contribution is so small (1/72) that the results presented would not have been impacted in any meaningful way.


