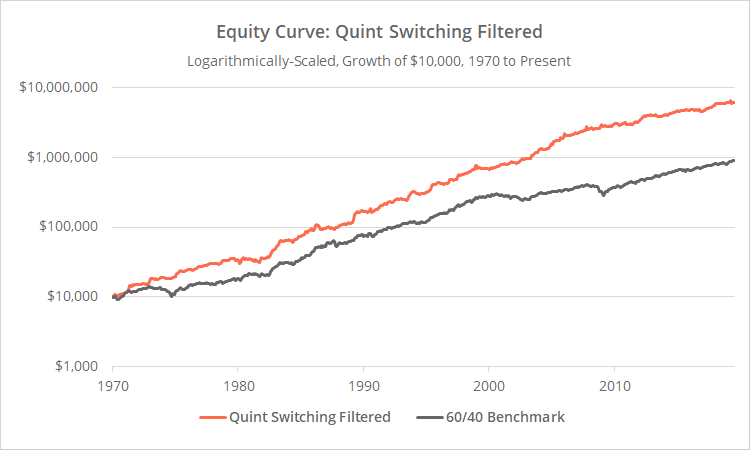
This is a test of the Quint Switching Filtered strategy from Lewis Glenn. On the surface this is a run-of-the-mill tactical asset allocation strategy based on short-term momentum, not unlike several strategies that we track. But digging a little deeper, we’ll highlight qualities that make this strategy unique – both for the better and the worse. Results from 1970 net of transaction costs follow.
Read about our backtests or let AllocateSmartly help you follow this strategy in near real-time.

Logarithmically-scaled. Click for linearly-scaled chart.
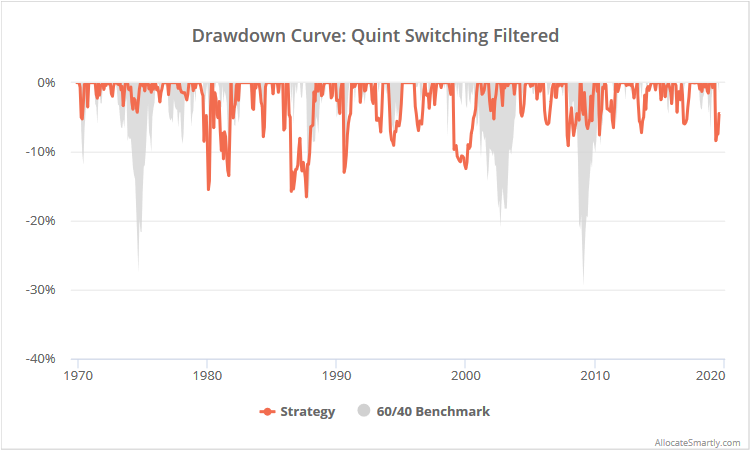
As shown in the stats below, Quint Switching Filtered (hereafter “QSF”) would have outperformed the benchmark by more than 4% per year while significantly reducing the maximum drawdown. Average correlation to other strategies that we track stands at just 0.38, making it potentially useful for combining with other strategies to manage portfolio volatility. So far, so good.
The backtest in the source paper was based on a 15-year period from 04/2003 to 02/2018. That makes the 33+ years prior to that out of sample. During this previously untested period, the strategy outperformed by 4.4% per year, while reducing max drawdown from -27.5% to -16.5%. That should be considered a feather in the cap for strategy robustness.
Strategy overview:
The strategy rules tested here are very simple:
- At the close on the last trading day of the month, measure the 3-month total return of five “risk assets”:
- SPY: S&P 500
- QQQ: Nasdaq 100
- EFA: International stocks (MSCI EAFE)
- EEM: Emerging market stocks (MSCI EM)
- TLT: Long-term US Treasuries
- If the 3-month return of any of those risk assets is negative, allocate the entire portfolio to a defensive asset, IEF (int-term US Treasuries), at the close.
- If the 3-month return of all of those risk assets is positive, allocate the entire portfolio to the asset with the highest 3-month return at the close.
- All positions are held until the last trading day of the following month.
Like a shy turtle that rarely leaves its shell:
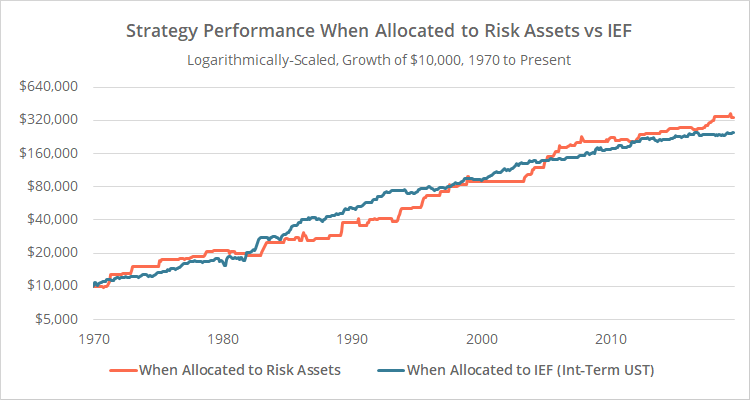
Because of QSF’s strict requirement that all risk assets have a positive 3-month return, it rarely actually holds any of them. Since 1970, QSF would have spent about 3 out of 4 months in the defensive asset: intermediate-term US Treasuries (IEF).
Despite that, strategy return has been driven equally by both IEF and the risk assets. In the graph below, we’ve shown strategy performance when allocated to risk assets (orange) versus IEF (blue). The strategy may spend much more time in IEF, but both have made an equal contribution to performance.

Logarithmically-scaled. Click for linearly-scaled chart.
Something strange that isn’t that strange after all:
On our first read of this paper, the inclusion of long-term US Treasuries (TLT) as a risk asset struck us as odd. It makes sense to say “if any of these true risk assets (SPY, QQQ, EFA or EEM) are weak, it might be a sign of impending weakness, so move the portfolio to the defensive asset”. But adding a traditionally defensive asset (TLT) into that mix is a strange choice. We believe that TAA models should, generally-speaking, “make sense”, and having this ill-fitted asset smelled like overfitting.
TLT was held in just 2.4% of months in our test, so TLT wasn’t a significant return driver. The primary role of TLT has been as a spoiler, causing the entire portfolio to move to the defensive asset, even if all the true risk assets (SPY, QQQ, EFA and EEM) are exhibiting positive momentum. Negative momentum in TLT alone can ruin the fun.
The key question is, is negative momentum in TLT actually predictive of next-month weakness in the other risk assets? Below we’ve stripped out all the other strategy rules to show how the risk assets have performed in the month following a positive vs negative TLT momentum score.
As the numbers above show, all of the risk assets have performed more poorly following a negative TLT momentum score. The effect was consistent over our entire sample. There appears to be evidence that the strategy’s inclusion of TLT is not that strange after all.
Note: We found something similar in our test of Vigilant Asset Allocation when AGG was the “strange” asset.
Things to be concerned about:
First, the strategy has spent 3 out of 4 months in intermediate-term US Treasuries (IEF), with no mechanism to rotate out of them when they struggle. That means that an extended period of rising rates would be a significant drag on strategy performance.
Most of this test (1981 onwards) covers a particularly fortuitous era for interest rate sensitive assets like IEF, due to a multi-decade march lower in yields. That won’t always be the case. See our previous work looking at how IEF and similar ETFs might perform in an era of rising rates. It’s not pretty. We model this exposure for all 50+ strategies that we track (for members), and QSF comes in at the very top of the list. None have as much potential exposure to rising rates.
Second, regardless of what the stats above show, this strategy should be treated as extremely aggressive. It’s probably not appropriate as a standalone investment. The stats are influenced by how much time the strategy spends in relatively low risk Treasuries (which will, for example, deflate “annual volatility”), but in any given month it could be 100% long a very risky asset. One solution is to combine it with other more moderate strategies (a task our site was specifically built to tackle).
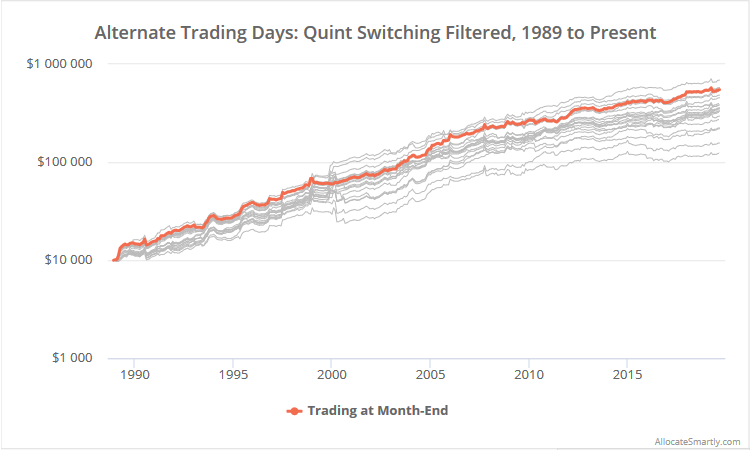
Third, the range of “alternate trading day” results are wider than any other strategy that we track. Let’s walk through what we mean by that for the uninitiated:
Most of the strategies that we track are designed to trade once per month, on the last trading day of the month. Our platform provides the ability to instead trade those strategies on any other day of the month, or to spread execution across multiple days. Note that we’re not simply moving the day of execution forward. We’re maintaining the “integrity” of the original strategy, but on other days of the month (learn more).
Generally-speaking, when we look at how a strategy would have performed on these alternate trading days, we’d like to see results in a relatively tight range. It’s a sign of strategy robustness. In the case of QSF, those alternate trading day results are all over the board.
Below we’ve shown how the strategy would have performed trading on all alternate trading days, from 1989 to present. Annualized returns range from a low of 8.5% to a high of 14.8%, and Sharpe Ratio from 0.42 to 1.02. This wide range in performance from something as innocuous as the day of the month traded, is termed “timing luck”.

Logarithmically-scaled. Click for linearly-scaled chart.
Obviously, QSF is very susceptible to timing luck. To some degree that’s expected. It’s using a very short-term measure of momentum to trade a single asset. Small day-to-day differences in asset performance (i.e. noise) could lead to radically different positions on any given day. Compounded over time, those differences could lead to very different long-term results.
If trading QSF it’s probably wise to either spread execution across multiple days of the month (aka “portfolio tranching”), or at the very least, to mix it with multiple other strategies (because combining strategies in and of itself helps to minimize timing luck, read more).
It’s different, but we like different:
There you have it. QSF looks like a straight-forward short-term momentum strategy, but digging a little deeper we find it’s a little different than other models that we track. That’s okay, we like different. Many of the strategies that we track trade based on common “themes”. Outside the box approaches likes QSF can, at the very least, act as unique portfolio diversifiers to help smooth out portfolio returns.
We appreciate Lewis Glenn’s contribution and for the opportunity to put his strategy to the test.
New here?
We invite you to become a member for about a $1 a day, or take our platform for a test drive with a free limited membership. Put the industry’s best tactical asset allocation strategies to the test, combine them into your own custom portfolio, and then track them in near real-time. Have questions? Learn more about what we do, check out our FAQs or contact us.


